
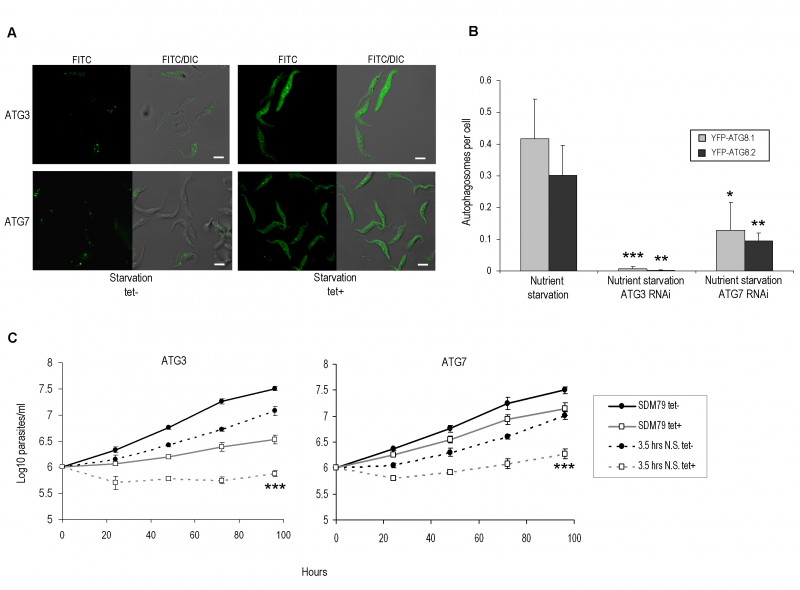
FIGURE 2: Procyclic form ATG3 and ATG7 RNAi mutants. Constitutive expression of YFP-ATG8.1 and YFP-ATG8.2 in PCF was visualised by fluorescent microscopy following RNAi of either ATG3 or ATG7 for 72 h before nutrient starvation in PBS for 2.5 h.
(A) Representative images, left hand images FITC filter set, right hand images DIC FITC merge. Scale bar 5 µm.
(B) The mean number of autophagosomes per cell was determined by counting >200 cells with data displayed as a mean of three replicate experiments. Error bars represent standard deviation and asterisks indicate where data differed significantly from the means of uninduced controls *p<0.05, ** p<0.01, ***p<0.001.
(C) ATG3 and ATG7 RNAi was induced for 72 h in cells expressing YFP-ATG8.1 before nutrient starvation for 3.5 h in PBS (dashed lines) or control treatment in SDM79 media (solid lines). Cells were re-seeded at 0 h in SDM79 + tet (empty boxes grey line, tet+) and SDM79 –tet (filled boxes black line, tet-) and growth was determined daily for 96 h. Data represent mean of three replicate experiments. Error bars show standard deviation and asterisks indicate where data differed significantly from the means of tet induced starved and non-starved lines at the 96 h time point ***p<0.001.