
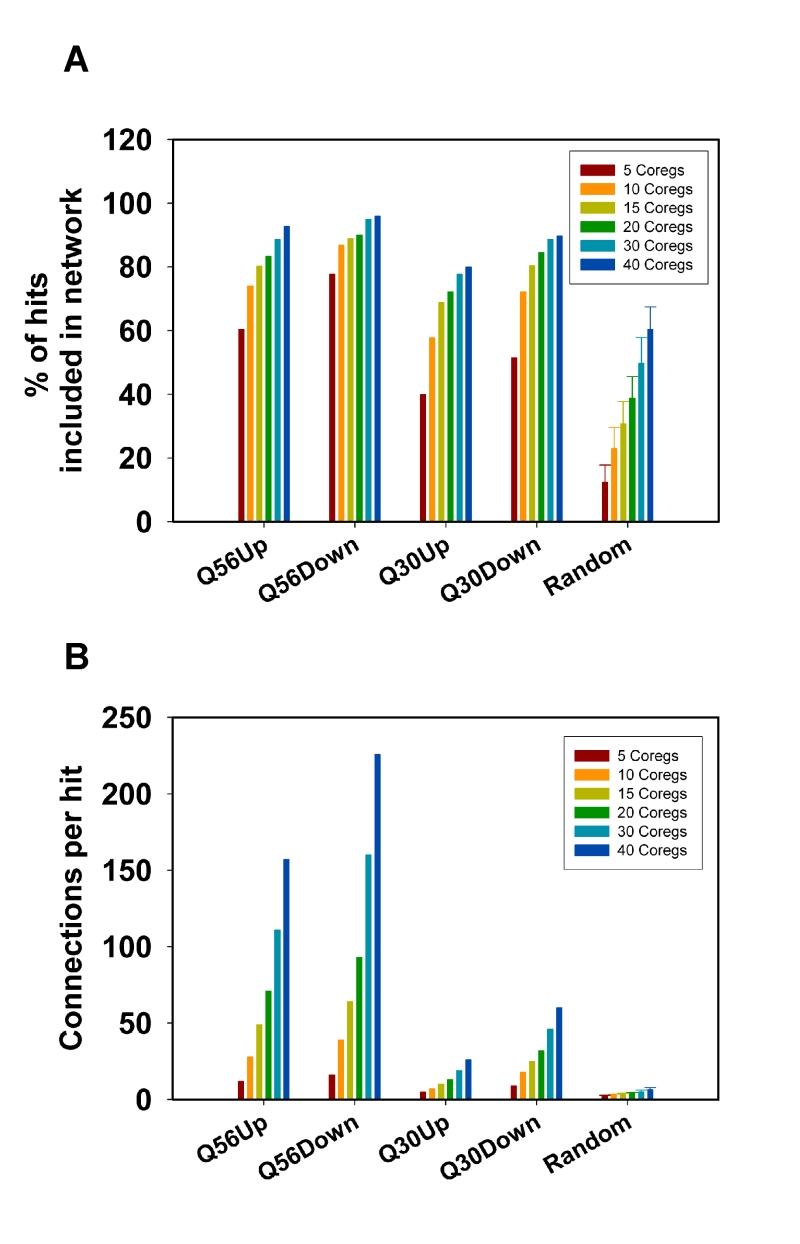
FIGURE 2: Analysis of network connectivity based on the used number of co-regulated genes. Connectivity parameters for hits derived from the Q56- and Q30 datasets were calculated for 100 hits. The best 5-40 co-regulators were obtained from the SPELL data sheets. A) Depicted are the number of hits, which are included in the network and B) the average number of connections per hit. As a control 100 random sets of genes were used and processed in the same manner. The error bars represent the standard deviation for the 100 random gene lists.