
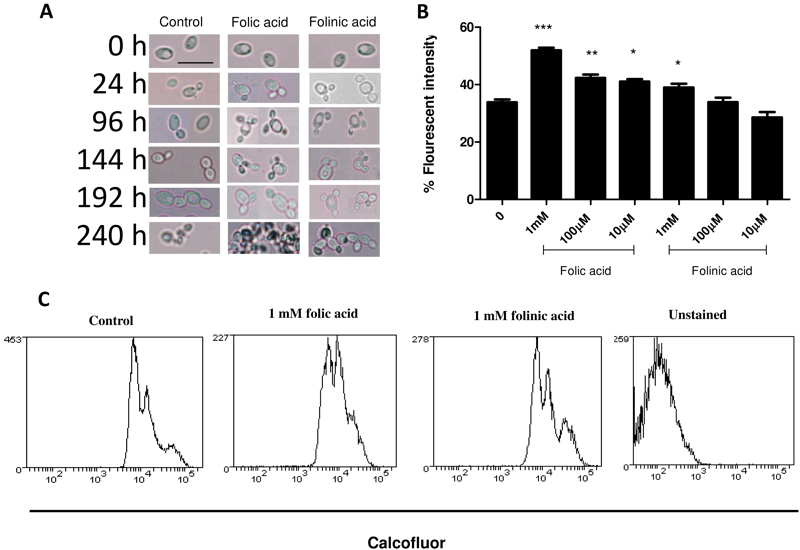
FIGURE 2: Effect of folates on yeast budding.
(A) Light microscopy images of C. glabrata in the presence of 100 µM folic acid and folinic acid compared to the control for up to 10 days. (Scale bar = 10 µm). Calcofluor staining of the bud scars in stationary phase yeast incubated in the presence of 1000, 100 and 10 µM folic acid and folinic acid, analysed by flow cytometry.
(B) Histograms represent the results from three independent experiments. (*** P < 0.005, ** P < 0.01,* P < 0.05).
(C) Flow cytometry profile of cell populations in the presence of 1 mM folic and folinic acid.