
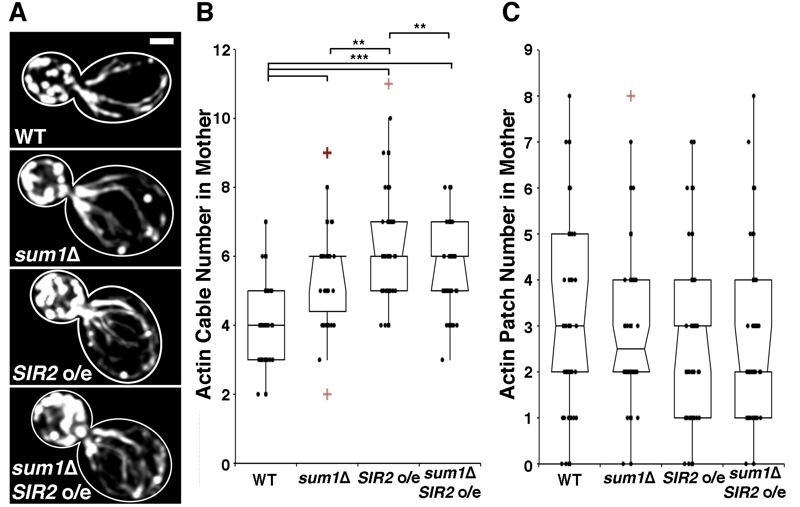
FIGURE 2: Overexpression of SIR2 and deletion of SUM1 have complementary roles in regulation of actin cytoskeletal integrity.
(A) Wild-type, sum1∆, SIR2 overexpressing (SIR2 o/e), and sum1∆ SIR2 o/e cells were stained with rhodamine-phalloidin as described in Materials and Methods. Scale bar represents 1 µm. Outlines were drawn from brightfield images.
(B) Notched dot box plot of the number of actin cables in wild-type, sum1∆, SIR2 o/e, and sum1∆ SIR2 o/e cells.
(C) Number of actin patches in the mother cell of wild-type, sum1∆, SIR2 o/e, and sum1∆ SIR2 o/e cells. n = 56 – 69 cells per strain. Data is representative of 2 independent trials. ** = P < 0.01, *** = P < 0.001. P values were calculated using Kruskal-Wallis testing.