
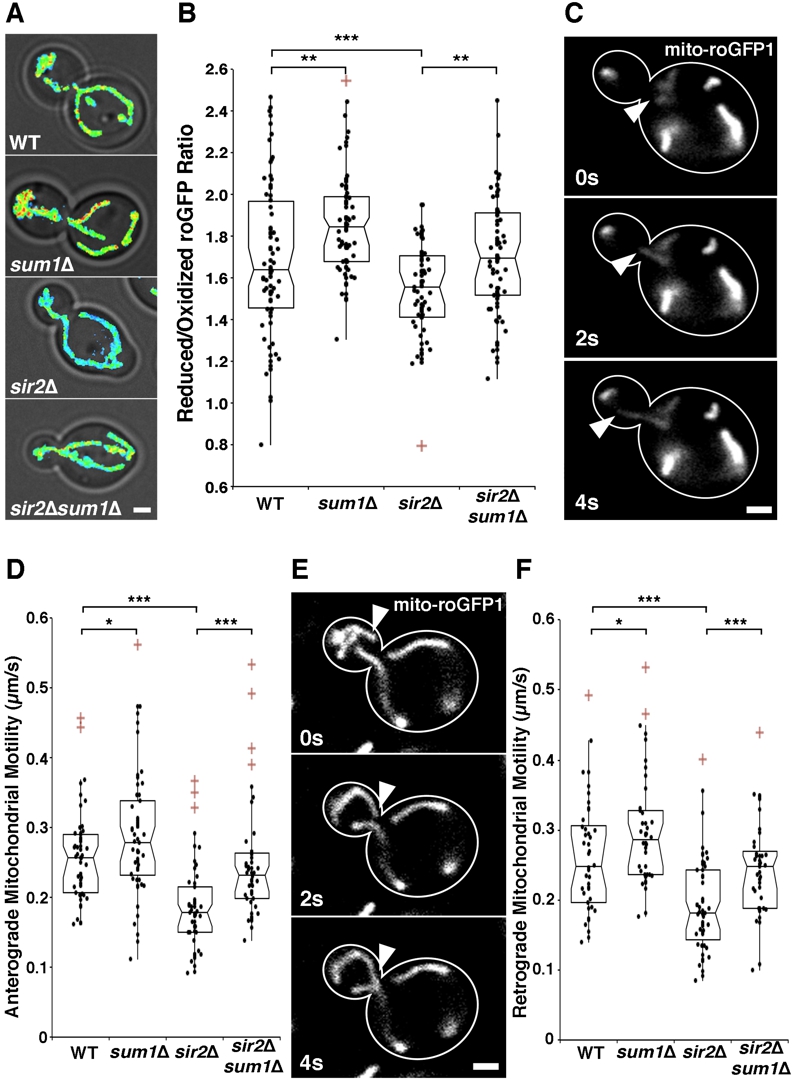
FIGURE 3: Deletion of SUM1 ameliorates defects in mitochondrial function in sir2∆ cells.
(A) mito-roGFP1 was used to visualize redox state of mitochondria in wild-type, sum1∆, sir2∆, and sir2∆ sum1∆ cells. Images are reduced:oxidized mito-roGFP1 ratios overlaid on phase images. Higher numbers and warmer colors indicate more reducing mitochondria. Scale bar, 1 µm.
(B) Notched dot box plot of the average reduced:oxidized mito-roGFP1 ratio in wild-type, sum1∆, sir2∆, and sir2∆ sum1∆ cells. n = 53 – 77 cells per strain. Data is representative of 3 independent trials.
(C) Time-lapse frames showing the tip of a Cit1p-GFP-labelled mitochondrial tubule undergoing anterograde movement.
(D) Notched dot box plot of anterograde mitochondrial velocity in wild-type, sum1∆, sir2∆, and sir2∆ sum1∆ cells. n = 48 – 54 cells per strain. Data is pooled from 3 independent trials.
(E) Time-lapse frames showing the tip of a mito-roGFP1-labelled mitochondrial tubule undergoing retrograde movement.
(F) Notched dot box plot of retrograde mitochondrial movement in wild-type, sum1∆, sir2∆, and sir2∆ sum1∆ cells. n = 48 – 54 cells per strain. Data is pooled from 3 independent trials. * = P < 0.05, ** = P < 0.01, *** = P < 0.001. P values were calculated using Kruskal-Wallis testing. Bars: 1μm. Cell outlines are shown in white.