
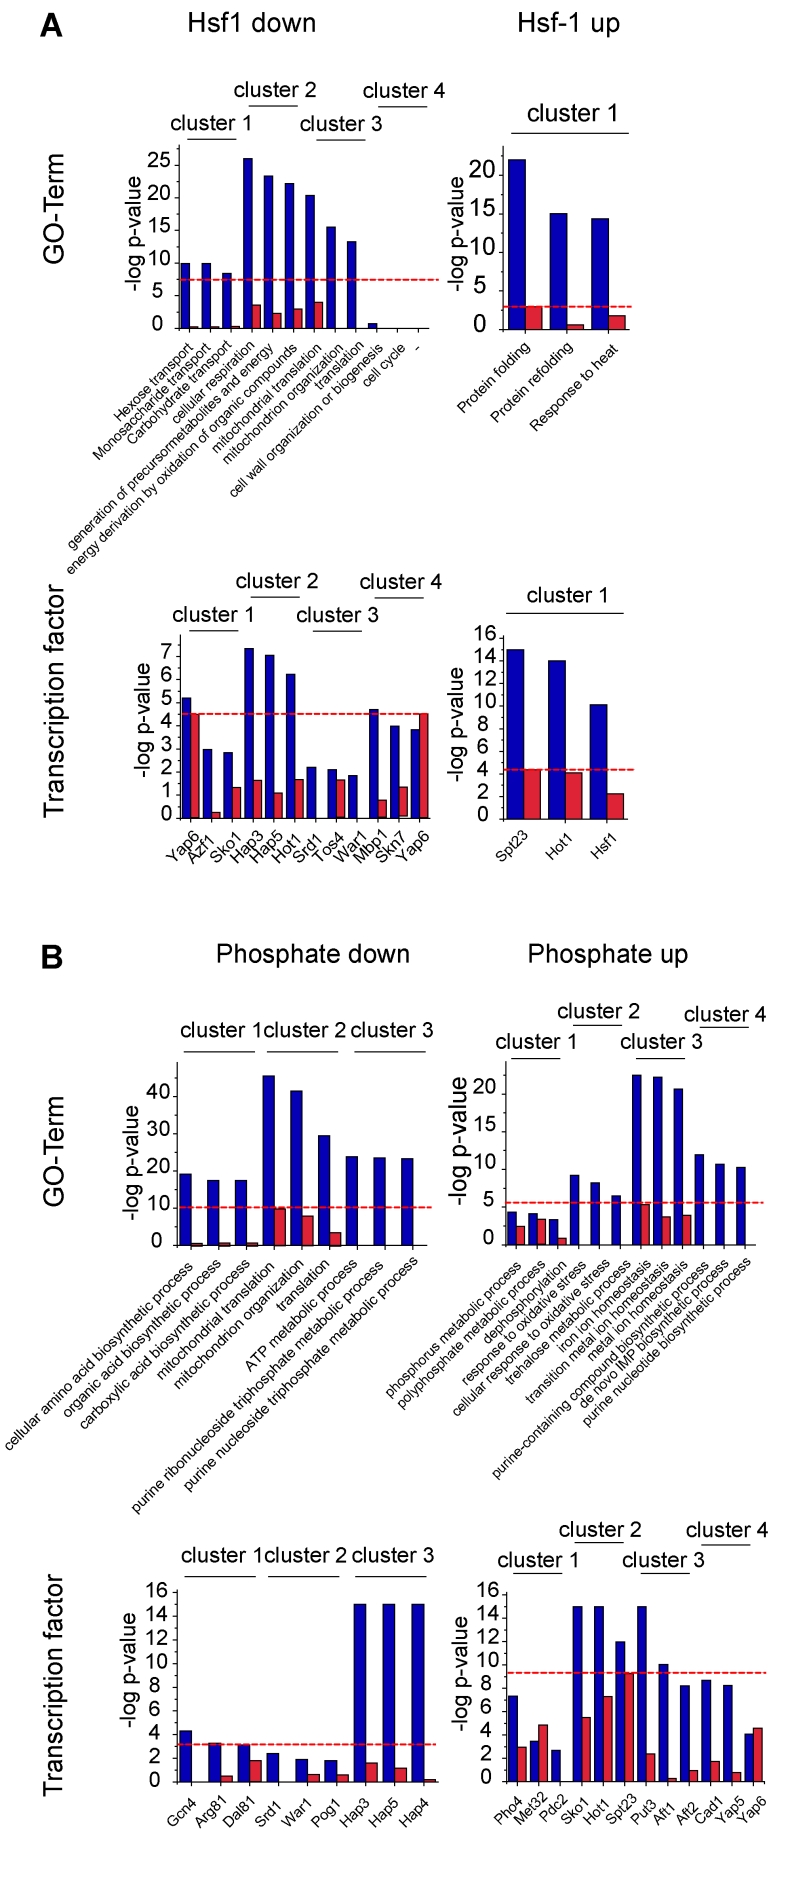
FIGURE 7: Biological processes and transcription factors of isolated clusters. Clusters are marked in Cytoscape as indicated in the corresponding figures (Figure 8, 9). The gene-ontology term (GO-term) biological process of the genes (upper panel) and the transcription factors regulating the genes (lower panel) of the isolated clusters (blue) and the full gene hit list (red) are depicted. The full analysis is listed in Table S1. The negative log of the p-value of the three highest ranking terms of the cluster analysis and the corresponding values of the full hit lists analysis are depicted. The red line marks the p-value of the best GO-term or transcription factor, when analyzing the non-clustered control of all hits. “-“ = analysis did not yield in any significant results.