
Back to article: Network dynamics of the yeast methyltransferome
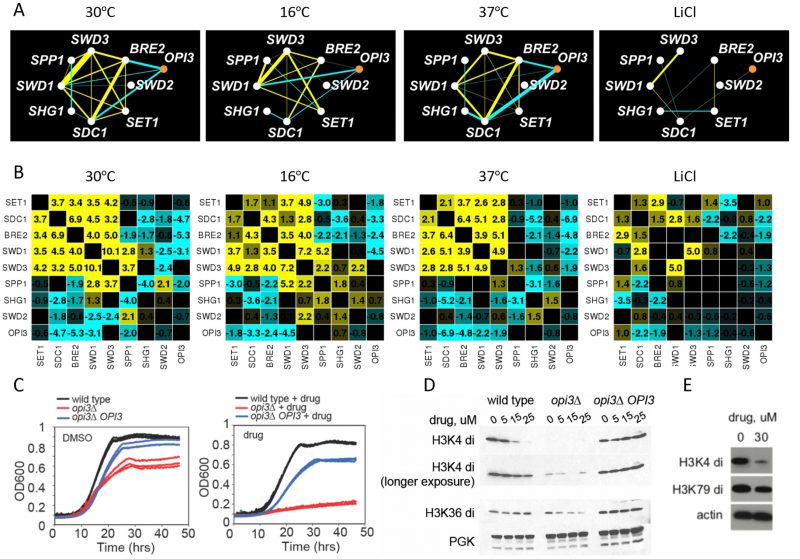
FIGURE 7: Exploring COMPASS and phospholipid MT connection. (A) Genetic interactions among COMPASS MTs and OPI3. Yellow; positive genetic interaction, cyan; negative genetic interaction. (B) Genetic interactions among COMPASS MTs and other genes in the four stress conditions. Yellow; positive genetic interaction, cyan; negative genetic interaction. (C) Overexpression of OPI3 rescues the drug-induced fitness defect opi3Δ in the presence and absence of the opi3Δ chemical probe. Growth of wild-type, opi3Δ and opi3Δ overexpressing OPI3, without drug (left panel) and with drug (right panel). Growth is measured by as O.D.600 (y-axis) as a function of time (hrs)(x-axis). (D) OPI3 is important for histone methylation. Levels of di-methylated H3K4 and H3K36 in the indicated strains and drug conditions. (E) Levels of di-methylated H3K4 and H3K79in in A549 cell in response to 30μM opi3Δ chemical probe.