
Back to article: Network dynamics of the yeast methyltransferome
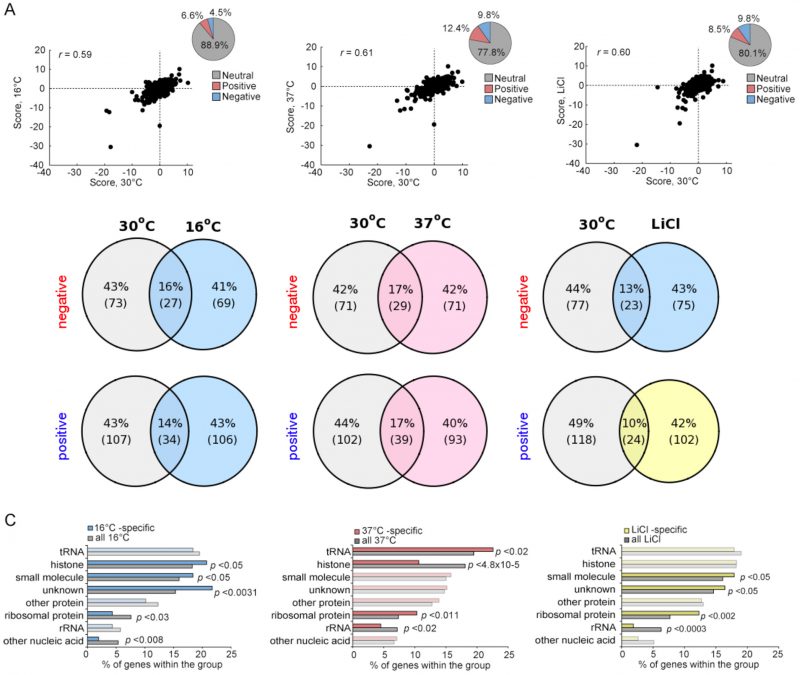
FIGURE 5: Plasticity of the methyltransferome in response to stress. (A) Genetic interactions for MT gene pairs under stress conditions (16°C, 37°C or LiCl) plotted against the those at 30°C. Insets: percentage of each interaction type. (B) Overlap of significant genetic interactions (|score| >2.5) between 30°C and the indicated stress conditions (C) Enrichment for genetic interactions between gene pairs by substrate type for stress conditions.