
Back to article: Network dynamics of the yeast methyltransferome
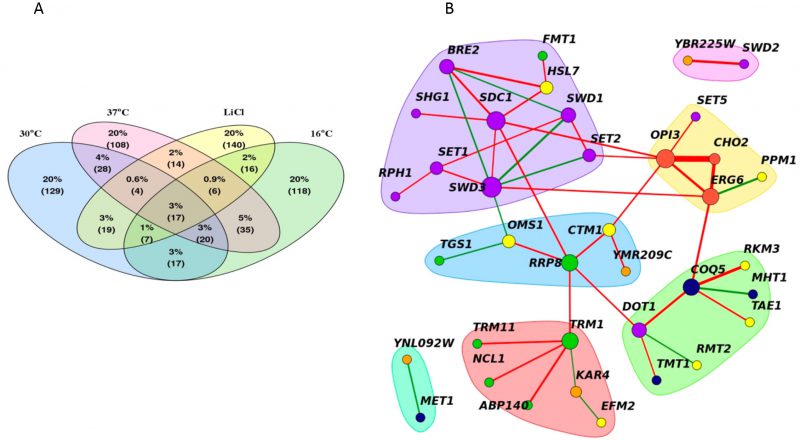
FIGURE 6: A core methyltransferase network. (A) Venn diagram of the shared significant interactions between all four conditions (30°C, 16°C, 37°C or LiCl). (B) The core methyltransferase genetic network shared by at least three of the four conditions tested. Red and green edges denote negative and positive genetic interactions, respectively. Line width represents average genetic interaction strength. Node color represents biological substrate; purple (histone), green (RNA), yellow (small molecule), red (lipid), orange (unknown) and navy (small molecule). Distinct groups were identified by clustering edge betweenness.