
Back to article: Guidelines for DNA recombination and repair studies: Cellular assays of DNA repair pathways
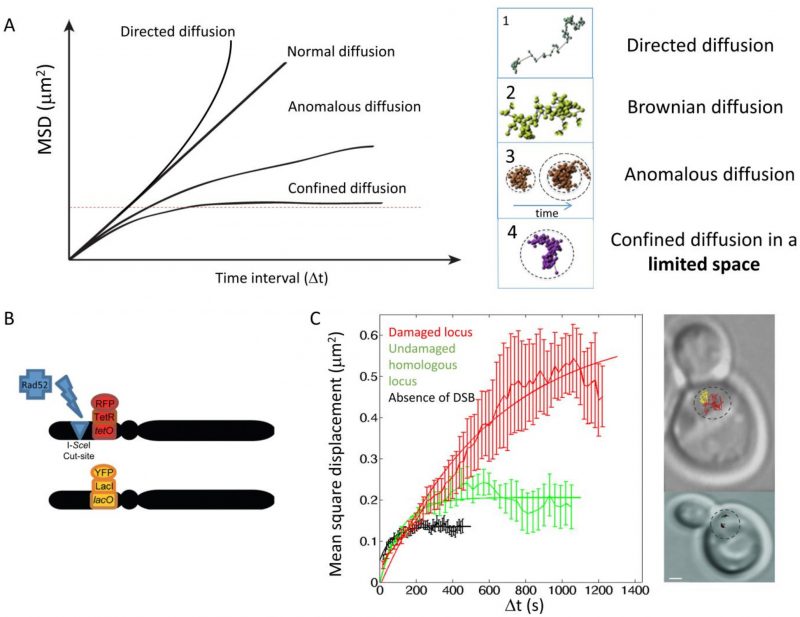
FIGURE 18: Studying chromatin mobility. (A) Left, theoretical Mean Square Displacement (MSD) curves for directive, Brownian, anomalous and confined diffusion. Right: corresponding typical trajectories for each mode of diffusion. (B) Experimental design to measure mobility at a chromosomal locus before and after DNA damage. A strain harboring two homologous and tagged loci (a tetO/TetR-RFP array inserted at the URA3 locus, and a lacO/LacI-YFP array inserted at the homologous URA3 locus) contains, a single I-SceI cut-site located 4 kb from the tetO array. A galactose-inducible I-SceI inserted at the LYS2 locus allows regulated induction of a single DSB under galactose control. (C) Left, experimental MSD curves obtained from the diploid strain described in (B) Black: MSD curve of either tagged locus in the absence of DNA damage. Red: MSD curve of the tetO locus, after an I-SceI-induced DSB next to the tetO site (local mobility). Green: MSD curve of the homologous locus harboring a lacO array, after an I-SceI-induced DSB next to the tetO site (global mobility). Right: to illustrate the change in chromatin mobility, typical trajectories are shown (black trace: URA3 locus before DNA damage; red trace: damaged URA3 locus; yellow trace: undamaged URA3 homologue). The MSD curves are reproduced from [369].
369. Miné-Hattab J, Rothstein R (2012). [DNA repair: finding the perfect match]. Med Sci 28(8-9): 714-716. doi: 10.1051/medsci/2012288014