
Back to article: Genome-wide analysis of yeast expression data based on a priori generated co-regulation cliques
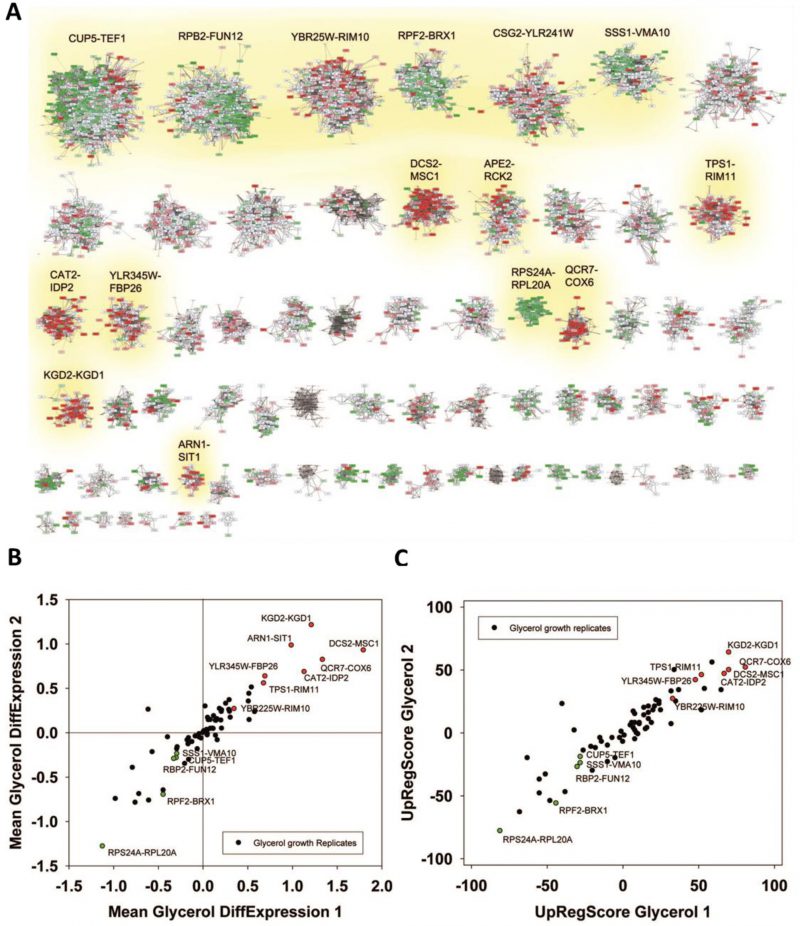
FIGURE 3: Analysis of microarray data sets on growth conditions. (A) Differences between glycerol-induced growth and glucose supported growth as described by [38]. Downregulation is indicated by four levels of green, upregulation by four levels of red. Significantly changed cliques of replicate 1 are highlighted with yellow background and labelled. (B) Correlation between two replicates and indication as to which values show significant upregulation in both replicates (red dots). The same is applied for downregulation (green labelling). (C) Comparison between two replicates regarding the UpRegScore of each clique. The labelling is performed as in Figure 2B.
38. Levy S, Ihmels J, Carmi M, Weinberger A, Friedlander G, Barkai N (2007). Strategy of transcription regulation in the budding yeast. PLoS One 2(2): e250. doi: 10.1371/journal.pone.0000250