
Back to article: Variants of the human RAD52 gene confer defects in ionizing radiation resistance and homologous recombination repair in budding yeast
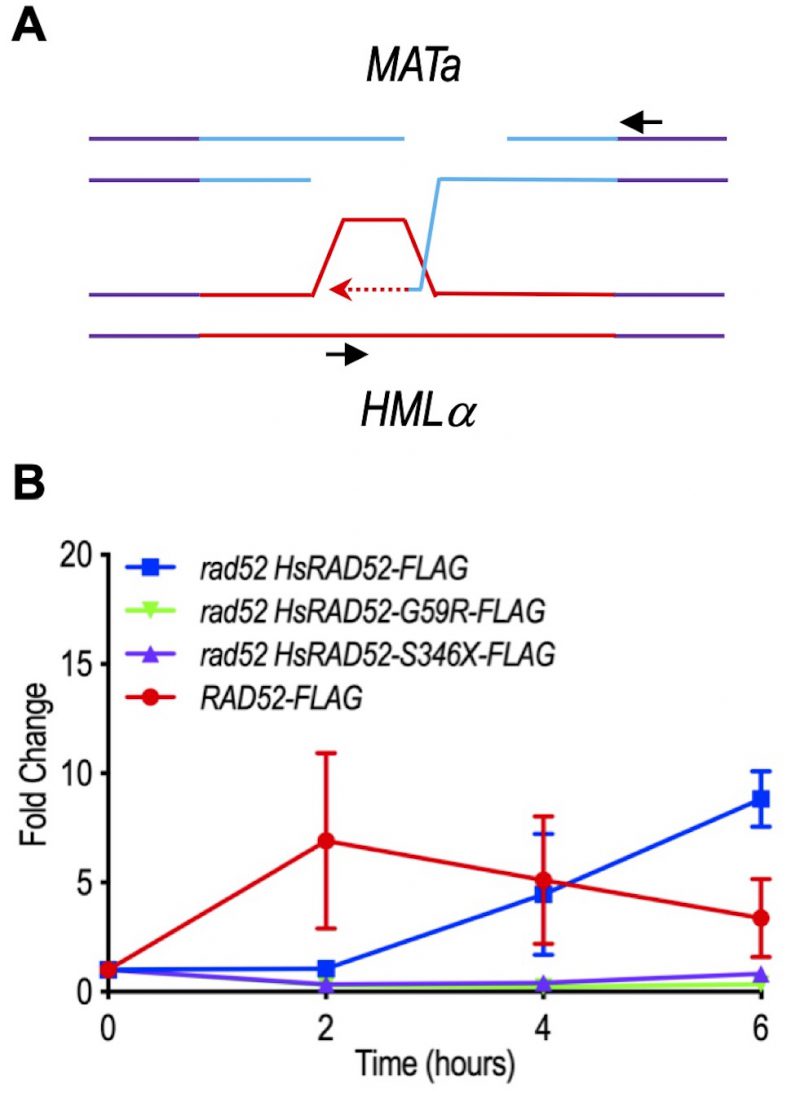
FIGURE 7: The adh1::HsRAD52-G59R-FLAG and adh1::HsRAD52-S346X-FLAG alleles confer defects in repair synthesis during MTI. (A) Cartoon depicting extension by repair DNA synthesis of putative heteroduplex formed upon association between sequences at the MAT and HML loci during MTI. Following DSB formation at the MAT locus (blue lines) exonucleolytic processing creates ssDNA onto which ScRad52-FLAG and HsRAD52-FLAG are proposed to bind. A search for homology putatively results in formation of a heteroduplex linking homologous sequences at the broken MAT locus with sequences at the intact HML locus (solid red lines). Extension of the heteroduplex by DNA repair synthesis (dotted red line) copies “α” information from HML that replaces “a” information lost from MAT, ultimately resulting in a change from MATa to MATα. Repair synthesis ultimately covalently joins “α” information from HML with sequences downstream from the MAT locus, which can be detected by PCR using the depicted primers (black arrows). (B) Repair synthesis was defective in rad52 adh1::HsRAD52-G59R-FLAG and rad52 adh1::HsRAD52-S346X-FLAG mutant cells. Genomic DNA was collected before immunoprecipitation from the same wild-type (ABX3961-4C), rad52 adh1::HsRAD52-FLAG (ABX3977-10C), rad52 adh1::HsRAD52-G59R-FLAG (ABX3985-55B), and rad52 adh1::HsRAD52-S346X-FLAG (ABX3994-18D) cultures used for the ChIP analyses described above (Fig 6). Extension by repair synthesis of the putative MAT/HML heteroduplex was quantitated by semi-quantitative end-point PCR using the primers depicted in panel A. DNA from the intact SAM1 locus was also quantitated as a signal for normalization. PCR products were separated on agarose gels, stained with ethidium bromide and band intensities were quantified using ImageJ. Normalized mean ratios and corresponding standard deviations from three independent time courses were calculated by dividing signal obtained from repair synthesis with the signal from the SAM1 control. All time point values were then normalized to the signal obtained before DSB formation (T=0 hrs) and plotted against elapsed time after DSB formation.