
Back to article: Detection of severe acute respiratory syndrome coronavirus 2 (SARS-CoV-2) and its first variants in fourplex real-time quantitative reverse transcription-PCR assays
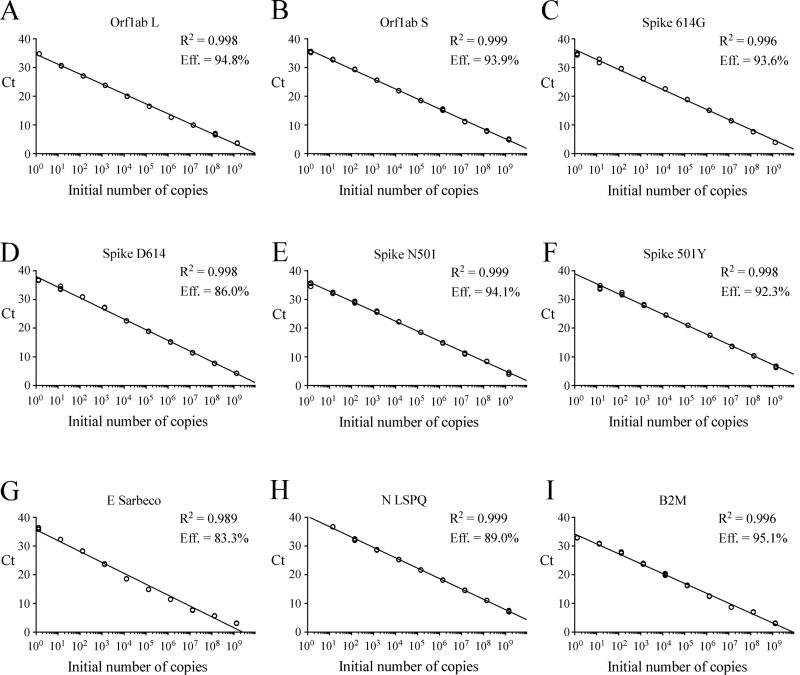
FIGURE 1: Standard curves to determine synthetic RNA copy number. (A–I) Tenfold serial dilutions ranging from 100 to 109 copies of Orf1ab L, Orf1ab S, Spike 614G, Spike D614, Spike N501, Spike 501Y, E Sarbeco (envelope), N LSPQ (nucleocapsid), and B2M synthetic RNA transcripts were analyzed by rRT-PCR assays. Each representative graph was generated by plotting the Ct values (y-axis) and the log of initial number of copies of synthetic transcripts (x-axis). Calculated linear correlation coefficients (R2) and percentage of amplification efficiencies are indicated for each primer-probe set. The graphs represent quantification of the results of three independent experiments.