
Back to article: Chromosome-condensed G1 phase yeast cells are tolerant to desiccation stress
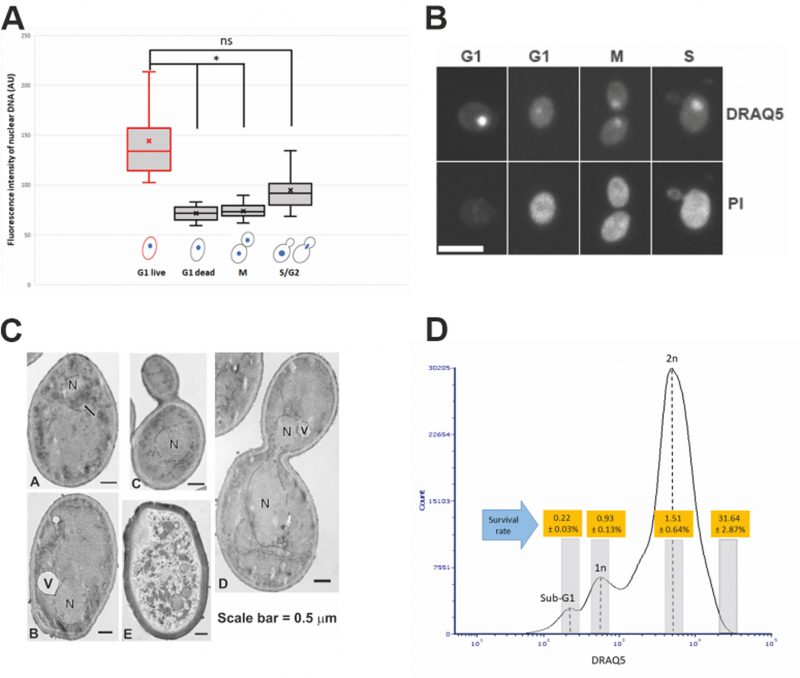
FIGURE 2: Chromosome condensation in desiccated G1 log-phase cells. (A) Measurement of DNA content of live/dead log-phase cells (after 14 days of desiccation) in different cell cycle phases. Approximately 400 cells were counted from each experiment and the data presented here are the sum of three independent experiments. *: p < 0.05; ns: not significant. (B) Representative confocal microscopy images of log-phase cells at different cell cycle stages after 14 days of desiccation, showing higher fluorescence intensity (indicated by DRAQ5 staining) in live G1 phase cells (indicated by negative PI staining). The dead G1, S and M phase cells (indicated by positive PI staining) had lower DNA fluorescence intensity (indicated by DRAQ5 staining). Scale bar = 5 μm. (C) Transmission electron microscopy images of log-phase cells after 14 days of desiccation (A); a G1 phase cell with condensed chromosome (arrow) (B); a G1 phase cell with no chromosome condensation (C); a S-phase cell with no chromosome condensation (D); a G2 phase cell with no chromosome condensation (E). a dead cell. N = nucleus, V = vacuole; (D) Cell sorting and cell viability of sorted log-phase cells after 14 days of desiccation. The histogram shows the flow cytometry analysis of the DRAQ5 stained log-phase cells. The grey bars on the histogram indicate cells that were sorted and tested for viability. Viability was tested by plating assay. Data were presented as mean ± standard error from three independent experiments.