
Back to article: Alcohols enhance the rate of acetic acid diffusion in S. cerevisiae: biophysical mechanisms and implications for acetic acid tolerance
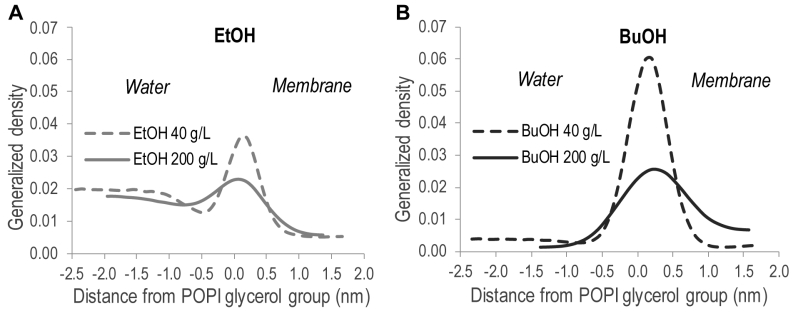
FIGURE 5: Location of the hydroxyl group of alcohols along the membrane normal relative to the glycerol backbone of the POPI lipid. X = 0 corresponds to the peak location of the glycerol backbone of the POPI lipid. Distances < 0 indicate the water phase, while distances > 0 indicate the lipid bilayer. (A) Ethanol. (B) n-butanol. The data shown are the mean values over one simulation ± standard deviation.