
Back to article: Antagonism between salicylate and the cAMP signal controls yeast cell survival and growth recovery from quiescence
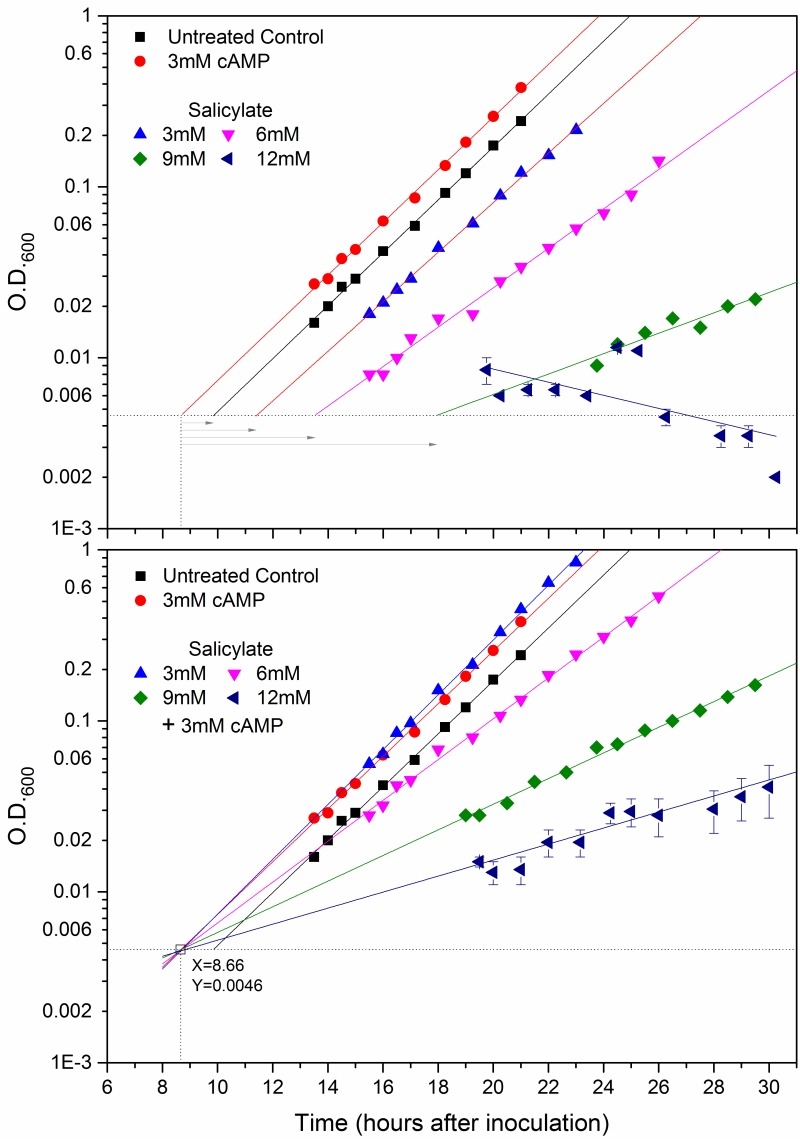
FIGURE 4: Efficient restoration of timely recovery of growth reactivation and rescue of viability of SA-repressed yeast cells by PKA activation. cyr1Dpde2Dmsn2Dmsn4D mutant cells were treated with increasing concentrations of salicylate, namely 0 (black, red; control cells), 3 (bright blue), 6 (pink), 9 (green)or 12(dark blue) mM SA. The cultures were treated with the increasing concentrations of salicylate in the presence (lower panel) or not (upper panel) of 3mM cyclic AMP (the same symbol for each salicylate dosage is used in both panels). Control cells without salicylate were also supplied (red) or not (black) with 3mM cAMP (upper and lower panel). Growth was monitored as O.D.600nm. increase and Log10 of experimental points were plotted versus time, time zero being when cells were inoculated. The plotted values referring to the conditions of 12mM salicylate plus or minus cAMP are mean O.D.600nm values ± SD, derived by two time courses followed simultaneously to all the other kinetics. All the experimental points were interpolated by linear regression curves. The values of significant parameters relative to the population growth and viability in these cultures are reported in Tables 1 and 2. There was a progressive inhibition of the exponential growth rate and a systematic increase of the time needed for growth reactivation as a function of salicylate dosage, until proliferation inhibition was a complete at 12mM salicylate (see also main text). In this severe condition the O.D.600nm decreased along with time, consistent with a dramatic loss of cell viability within the population (Table 2). The activation of PKAs with exogenous cAMP (lower panel) suppressed the loss of viability and the delay of growth reactivation at any salicylate concentration (see also Table 1). This is graphically shown by a single point of convergence (marked by a clear square, o) of all the curves with cAMP despite their very different slopes, this point corresponding to the common density of initial inoculums (O.D.600@0.005) (for more explanations see main text). Its coordinates (dotted lines) were X=8.66 hours and Y=0.0046 units of O.D.600nm as shown in figure. This unique point was considered also the appropriate reference time (see main text) from which the delays of growth recovery due to salicylate could be calculated in the upper panel as represented by the gray right-pointing arrows of increasing lengths (see also Table 1).