Back to article: Identification of Ftr1 and Zrt1 as iron and zinc micronutrient transceptors for activation of the PKA pathway in Saccharomyces cerevisiae
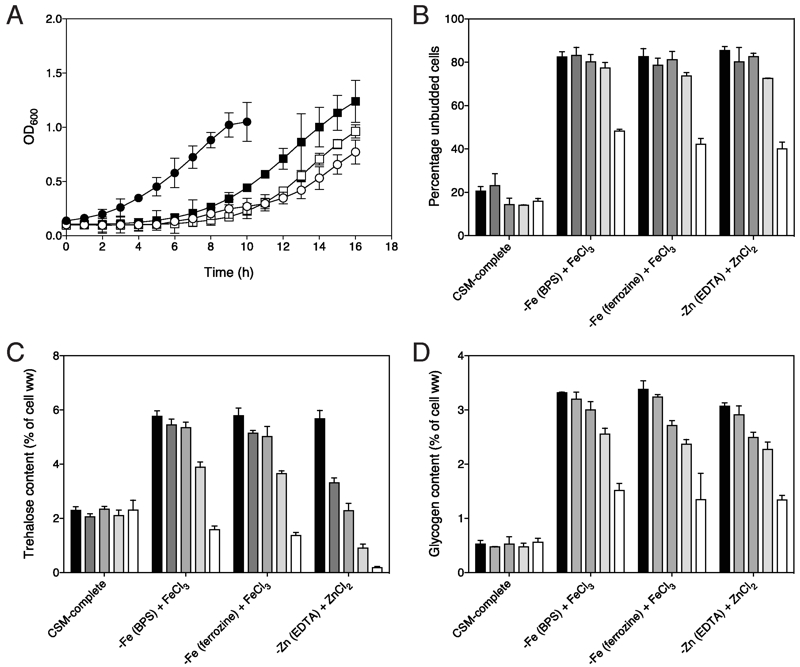
FIGURE 3: Reversal of the low-PKA phenotype developed in response to iron or zinc deprivation is specific for iron or zinc, respectively.
(A) Growth induction by re-addition of 100 μM of either FeCl3 or ZnCl2 at t = 0 to cells that had been deprived for 4 days in the respective metal ion deprivation media. Growth was measured by determination of OD600. (closed circles) all trace medium, (closed squares) ferrozine iron starvation medium + FeCl3, (open squares) EDTA zinc starvation medium + ZnCl2, (open circles) BPS iron starvation medium + FeCl3, n = 2
(B) Percentage of unbudded cells after re-addition of 100 μM of either FeCl3 or ZnCl2 at t = 0 to cells that had been deprived for 4 days in the respective metal ion deprivation media indicated. The shaded bars represent 0, 2, 4, 8 and 12 h after metal ion re-addition, n = 2.
(C) Trehalose mobilization after re-addition of 100 μM of either FeCl3 or ZnCl2 at t = 0 to cells that had been deprived for 4 days in the respective metal ion deprivation media indicated or had not been starved for iron (CSM-complete).
(D) Glycogen mobilization after re-addition of 100 μM of either FeCl3 or ZnCl2 at t = 0 to cells that had been deprived for 4 days in the respective metal ion deprivation media indicated or had not been starved for iron (CSM-complete).
(C,D) The shaded bars represent 0, 30, 60, 120 and 240 min after metal ion re-addition, n = 2.

