
Back to article: Improvement of biochemical methods of polyP quantification
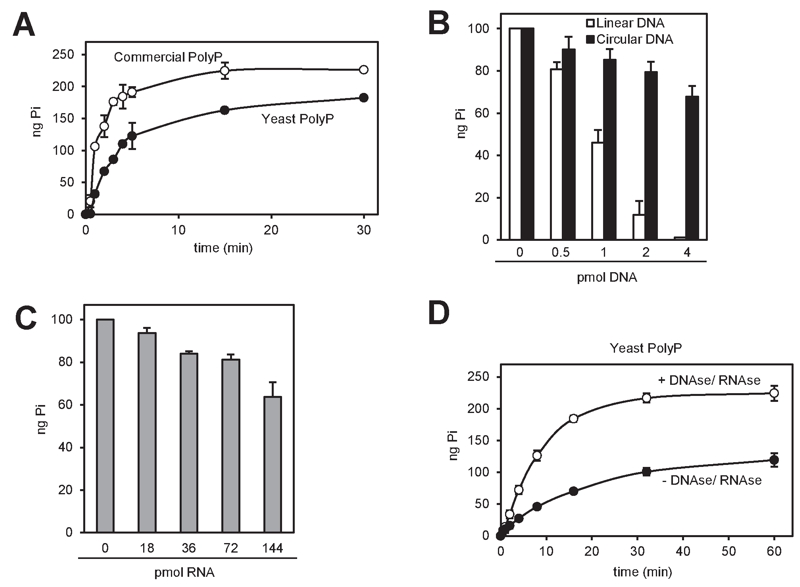
FIGURE 4: rPpx1 activity is inhibited by the presence of DNA and RNA.
(A) Kinetic of the rPpx1 polyP digestion. rPpx1 (10 ng) was incubated with 250 ng of commercial polyP or yeast polyP, in 20 mM Tris-HCl pH 7.50 containing 5 mM magnesium acetate and 100 mM ammonium acetate at 37°C. Samples were taken at the indicated times to quantify the released Pi. Mean ± SEM from 3 independent experiments is shown.
(B) rPpx1 activity on polyP in the presence of increasing amount of DNA. rPpx1 (10 ng) was incubated with 100 ng of commercial polyP in 20 mM Tris-HCl pH 7.50 containing 5 mM magnesium acetate and 100 mM ammonium acetate and at 37°C during 20 min with increasing concentrations of DNA (both circular and linear). The graph represents the released Pi in each condition. Mean ± SEM from 3 independent experiments is shown.
(C) rPpx1 activity on polyP in the presence of increasing amount of RNA. Same experiment as in B, but with increasing concentrations of RNA. The graph represents the released Pi in each condition. Mean ± SEM from 3 independent experiments is shown.
(D) Kinetics of rPpx1 polyP digestion in the presence of DNA and RNA. rPpx1 (1 ng) was incubated with 250 ng of yeast polyP previously treated or not with a DNAse/ RNAse solution in 20 mM Tris-HCl pH 7.50 containing 5 mM magnesium acetate and 100 mM ammonium acetate at 37°C. Samples were taken at the indicated times and the released Pi was quantified. Mean ± SEM from 3 independent experiments is shown.