
Back to article: Mutational analysis of fructose-1,6-bis-phosphatase FBP1 indicates partially independent functions in gluconeogenesis and sensitivity to genotoxic stress
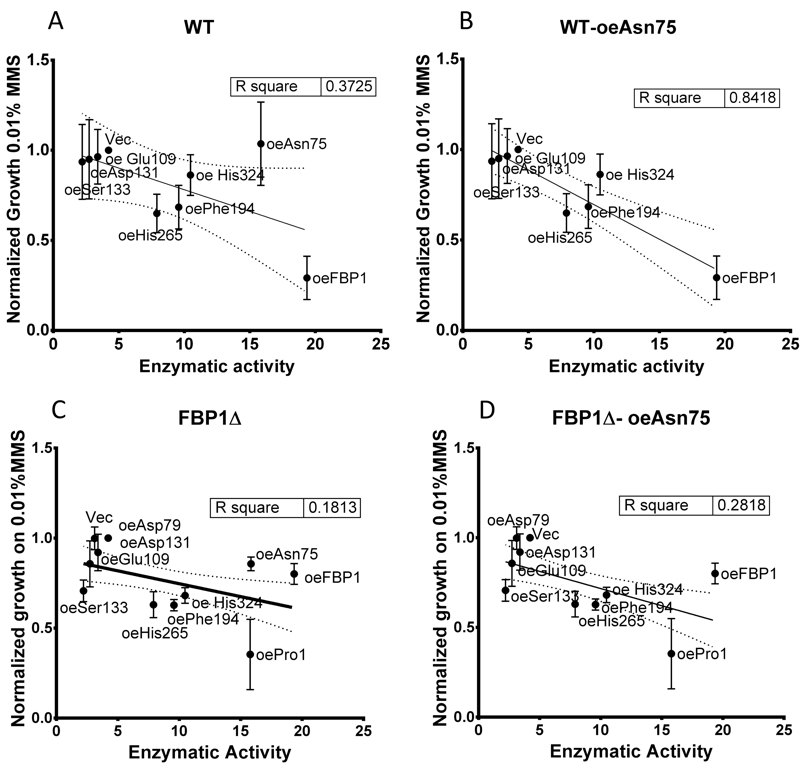
FIGURE 7: Linear correlation between enzymatic activity and growth on SD-Ura agar with 0.01% MMS in drop-tests.
(A) wt strains; (B) wt strains excluding Asn75; (C) fbp1∆ strains; (D) fbp1∆ strains excluding Asn75. MMS growth values are taken from the spot-intensity quantification of three independent drop tests on SD-Ura agar with 0.01% MMS. N = 3; error bars represent SD.