
Back to article: Single telomere length analysis in Ustilago maydis, a high-resolution tool for examining fungal telomere length distribution and C-strand 5’-end processing
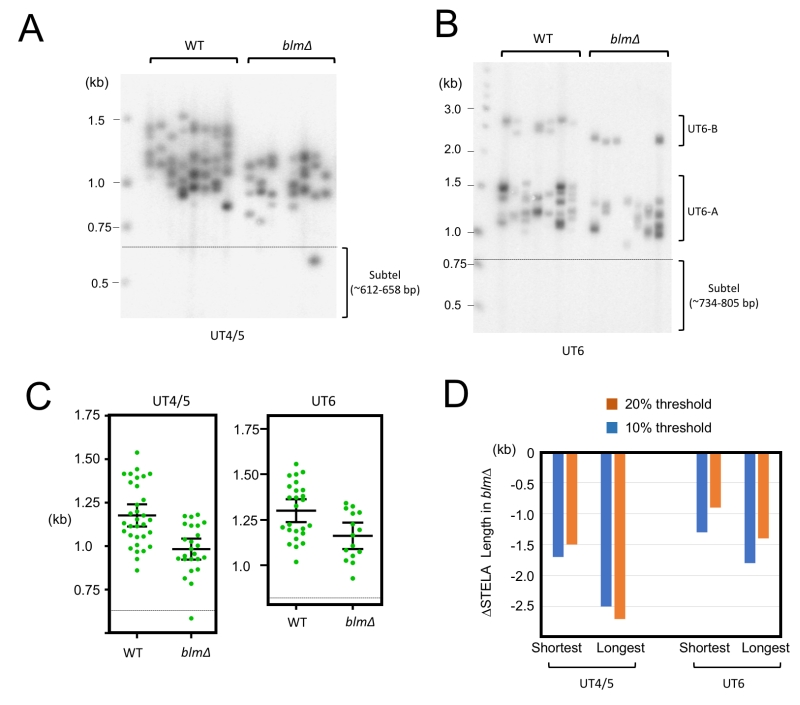
FIGURE 3: STELA comparison of telomeres in the wild type and blm∆ strains. (A) UT4/5 STELA assays were performed in parallel using wild type and blm∆ DNA. (B) UT6 STELA assays were performed in parallel using wild type and blm∆ DNA. (C) The STELA products in 3A and 3B were analyzed using the TESLA software, and the results plotted. Error bars designate standard errors of mean. (D) The telomere threshold lengths that mark the upper (or lower) quintile (20%) or decile (10%) of telomeres from the rest were determined for the various STELA samples. The reductions in the threshold lengths in blm∆ relative to wild type samples are then plotted.