
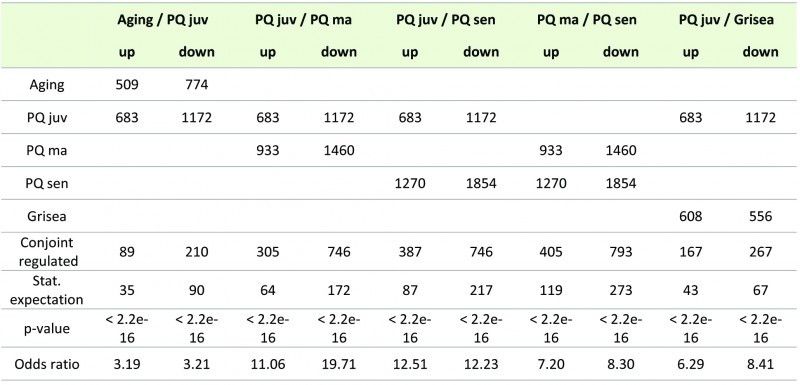
TABLE 1. Global gene regulation in the P. anserina wild type stressed by PQ and during aging.
The table shows the number of differentially regulated genes (factor < 3; pV < 0.01) of all analyzed transcriptome data. In the individual columns two data sets are compared (i.e. aging and PQ stress in juvenile cultures), respectively. The lines show the number of differentially expressed genes at the specified treatment. The amount of differentially regulated transcripts in the specific direction in both treatments is depicted in the line ‘conjoint regulated’. The statistical expectation (‘stat. expectation’) provides the number of genes which is expected to be regulated if the two treatments initiate random gene regulation. The p-value was calculated by Fisher’s exact test. Since the calculation of p-values lower than 2.2e-16 are identical, we included the odds ratio to clarify the level of similarity in transcript generation. The odds ratio is a measure for statistical dependence. A high odds ratio indicates a high probability for a regulation of a gene in the same direction during both compared condition.