
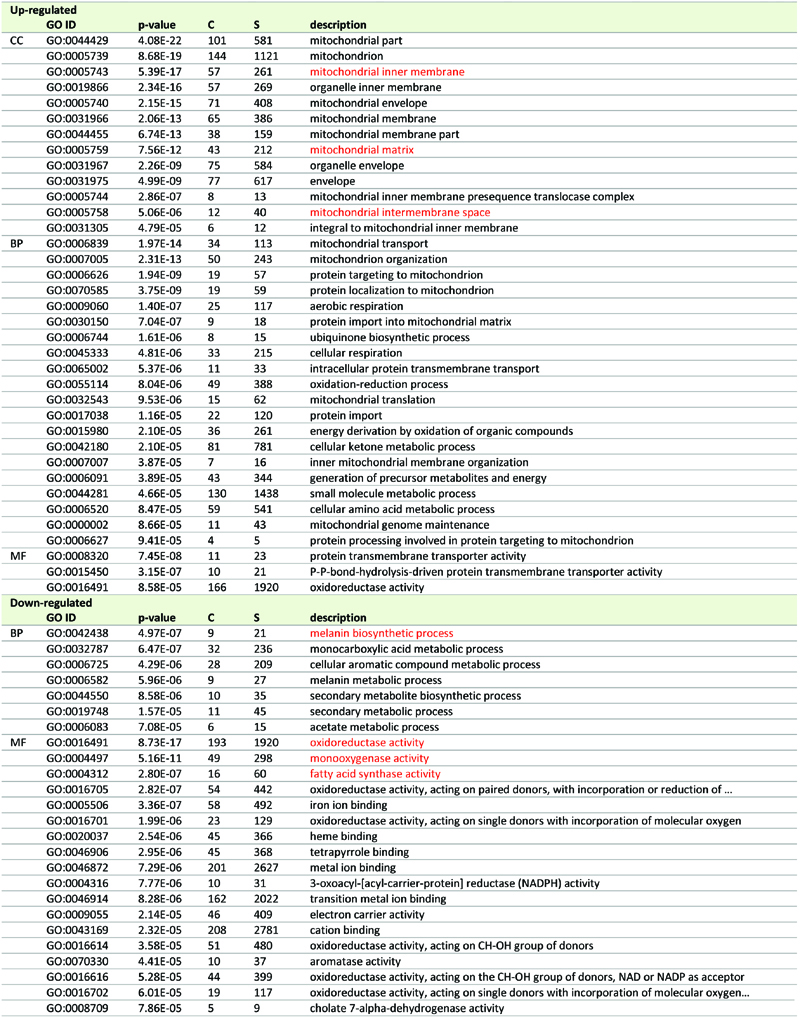
TABLE 2. GO enrichment analysis of transcriptome data of juvenile PQ-stressed P. anserina showing differential expression.
All differentially expressed genes (Factor < 3; pV < 0.01) were analyzed. GO terms with pV < 1E-5 are shown. The GO terms referred to in the text are highlighted in red. CC: Cellular Component; BP: Biological Process; C: Count (number of genes of respective GO Term in the group (up- or down-regulated)); S: Size (total number of P. anserina genes with the respective GO term).