
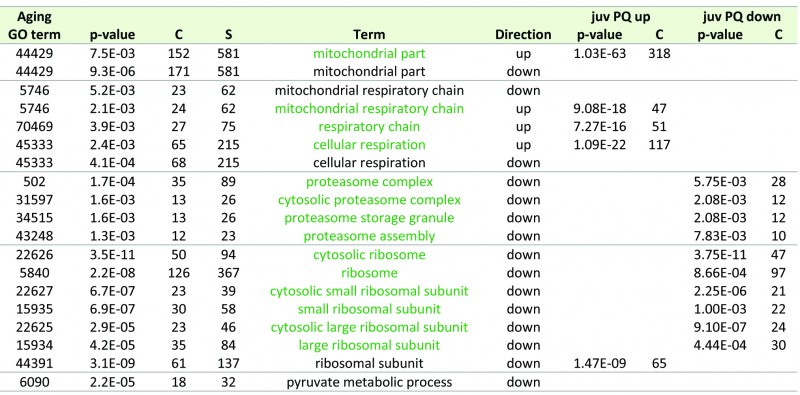
TABLE 3. Comparison of enriched GO terms in the data set of PQ-stressed P. anserina cultures with those from an earlier longitudinal aging study [19].
Terms that are enriched in the same group (up- or down-regulated) during aging and PQ-stress are highlighted in green. Similar GO terms are grouped. CC: Cellular Component; BP: Biological Process; C: Count (number of genes of respective GO Term in the group (up- or down-regulated)); S: Size (total number of P. anserina genes with the respective GO term).