
Back to article: Forced association of SARS-CoV-2 proteins with the yeast proteome perturb vesicle trafficking
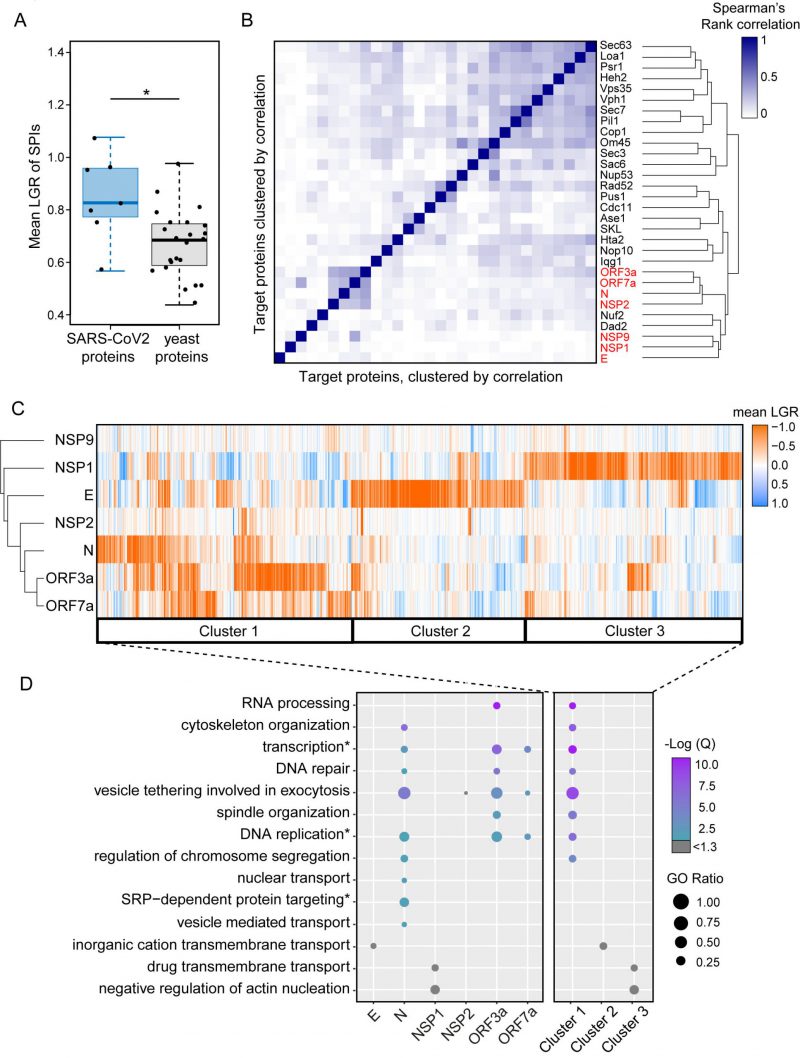
FIGURE 3: Clustering of SPIs from SARS-CoV-2 screens and yeast screens. (A) Compared to previous SPI screens which use yeast proteins of interest, the SARS-CoV-2 SPIs, on average, have higher LGRs. Statistical significance was assessed using Welch's two sample t-test (the two asterisks, * indicate a p-value of = 0.029). Boxplot parameters are as in Figure 1D. (B) Hierarchical clustering of Spearman's rank correlation between the LGRs from all screens indicate that SARS-CoV-2 screens (red) are less correlated to yeast screens, except for Nuf2 and Dad3. The darker blue colours indicate stronger correlation of LGR data. (C) Proteins identified as SPIs in one of more screens out of the seven viral protein screens were clustered based upon their mean LGR values using centroid linkage. Three distinct clusters of GFP proteins were identified (Cluster 1-3). (D) Enrichment analysis of gene ontology (GO) biological process terms across the seven screens and clusters from panel C. P values were calculated using a hypergeometric test and corrected for multiple hypothesis testing to produce a false discovery rated corrected, Q-value. The negative logarithm of the Q value is shown from purple (high) to turquoise (low); a -Log(Q) value of 1.3 is equivalent to p=0.05, with higher -Log(Q) values indicating greater statistical significance. -Log(Q) values below 1.3 are shown in grey. GO ratio (size of the circle) indicates the proportion of genes in a GO term were found for each enrichment.