
Back to article: Integrative modules for efficient genome engineering in yeast
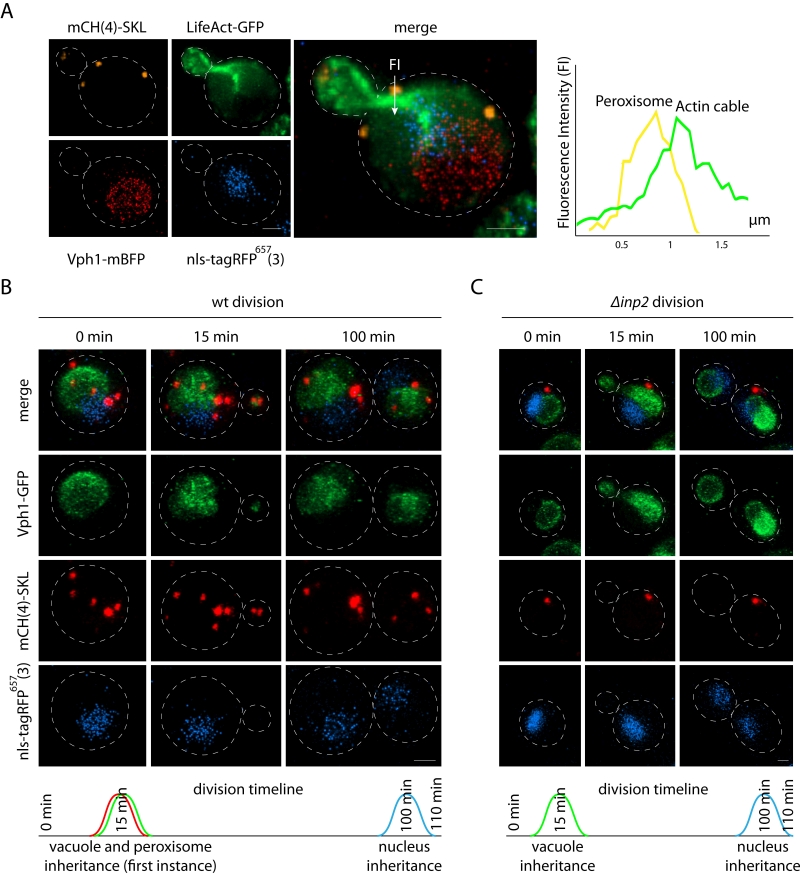
FIGURE 2: Proof of concept – Organelle inheritance order during division. (A) In vivo 4-color imaging of peroxisome (SKL signal C-terminally fused to 4 mCherry (mCH) on pDK-UT), actin (LifeAct fused to GFP on pDK-AT), nucleus (SV40 nls signal fused to 3 far-red fluorophores on pDK-HT), and vacuole (VPH1 endogenously tagged with mBFP), the scale bar is 1 µm. The graph represents proximity of peroxisome to actin cable during division, Fluorescence Intensity (FI) was calculated along the x axes (arrow on the merge image) for red (peroxisome) and green (actin) channels. (B) The timeline of organelle inheritance in the wild type (wt) strain, scale bar is 1 µm, time points represent the average (n = 30) time of organelle inheritance from the start of division, strain carries SKL signal C-terminally fused to 4 mCherry (mCH) on pDK-UT module, SV40 nls signal fused to 3 far-red fluorophores on pDK-HT module, and VPH1 endogenously tagged with GFP. (C) The timeline of the organelle inheritance in the Δinp2 strain, scale bar is 1 µm.