Back to article: Arsenite treatment induces Hsp90 aggregates distinct from conventional stress granules in fission yeast
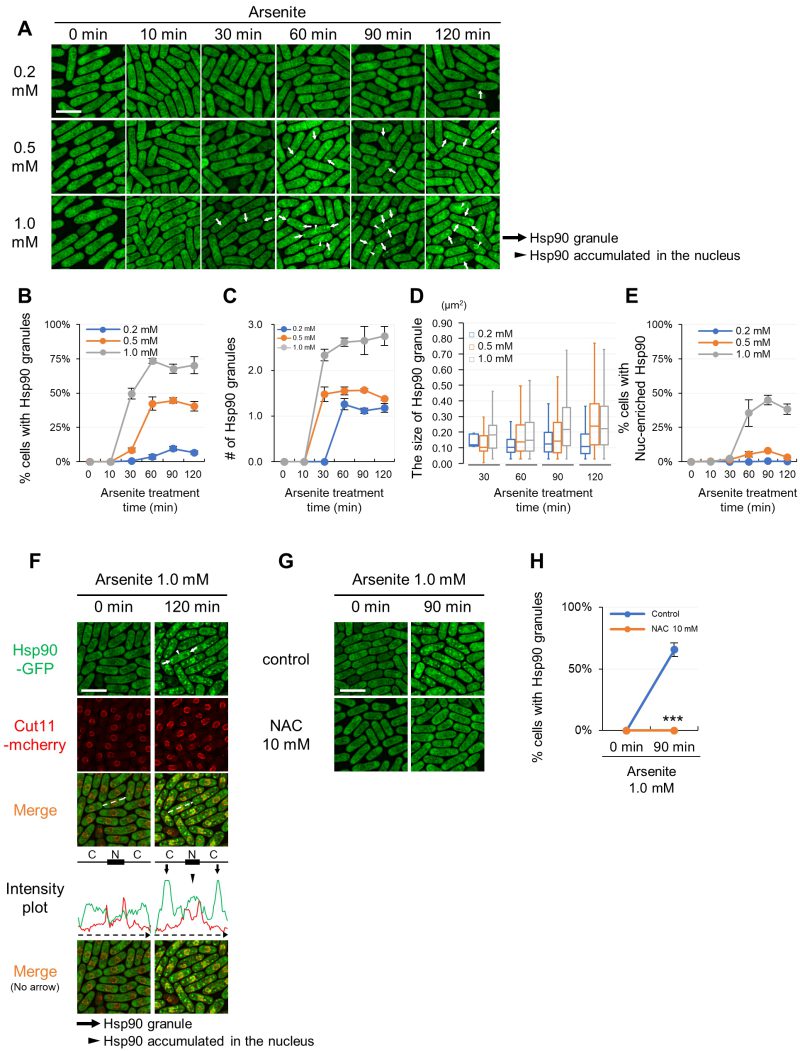
FIGURE 1: Hsp90 aggregates in the cytoplasm and accumulates in the nucleus upon arsenite stress via a ROS-involving mechanism. (A) Representative fluorescence images of the cells expressing GFP-tagged Hsp90 from its endogenous promoter under arsenite conditions (0.2 mM, 0.5 mM, and 1.0 mM) at 27◦C. The minutes after arsenite addition are indicated above the images. (B) Percentage of the cells with Hsp90 granules. (C) The number of Hsp90 granules per cell in Hsp90 granule-positive cells. (D) The size of Hsp90 granules. The box signifies the 25-75th percentiles and the median is represented by a short line within the box. The whiskers show the range of data. (E) Percentage of the cells with Hsp90-enriched nucleus. (F) Line intensity plot of Hsp90-GFP (green) and Cut11-mcherry (red) for the representative image of the cells incubated with or without 1.0 mM arsenite for 120 min at 27◦C. The dashed arrows in the merged images correspond to those below the intensity plot, and the line and box above the intensity plot indicate the positions of cytoplasm (C) and nucleus (N), respectively. (G) Effect of a ROS scavenger, n-acetylcysteine (NAC), on the arsenite-mediated Hsp90 granule formation. Cells were pre-incubated with or without 10 mM NAC for 2 min and then observed before or after treatment with 1.0 mM arsenite for 90 min at 27◦C. (H) Percentage of Hsp90 granule-positive cells from (G). Scale bars: 10 µm. Arrows and arrowheads indicate representative Hsp90 granules and the Hsp90-enriched nuclei, respectively. The graphs show mean ± SE (n=3). P***<0.001; significantly different from each sample by paired Student’s t-test.

