
Back to article: A complex remodeling of cellular homeostasis distinguishes RSV/SARS-CoV-2 co-infected A549-hACE2 expressing cell lines
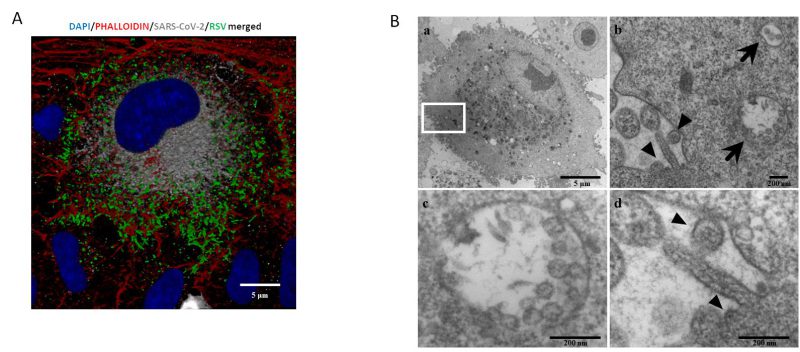
FIGURE 3: Single cell in vitroco-infection assessment. (A) Representative IF image of combined RSV-F and SARS-CoV-2-N proteins 48 hpi in a co- infected A549-hACE2 cell (DAPI in blue, phalloidin in red, N-SARS-CoV-2 in grey, F-RSV in green). Bars correspond to 5 µm. (B) a. Representative electron microscopy image of a A549 cell co-infected with SARS-CoV-2 and RSV at 72 hpi. Scale bar= 5 µm; b. A greater enlargement of the outlined area of the fig. (a) showing the morphological features of the co-infection with SARS-CoV-2 (arrows) and RSV (arrowheads). Scale bar= 200 nm; c. High magnification of a vesicle containing multiple SARS-CoV-2 assembled virions (average diameter ≈80 nm). Within virions, the nucleocapsid is visible as small electron-dense dots. Scale bar=200 nm; d. Higher magnification of RSV virion (arrowheads) budding from the surface of the infected cell, showing a spherical and the nucleocapsid which appears as electron-dense dots. Scale bar= 200 nm.