Back to article: Forced association of SARS-CoV-2 proteins with the yeast proteome perturb vesicle trafficking
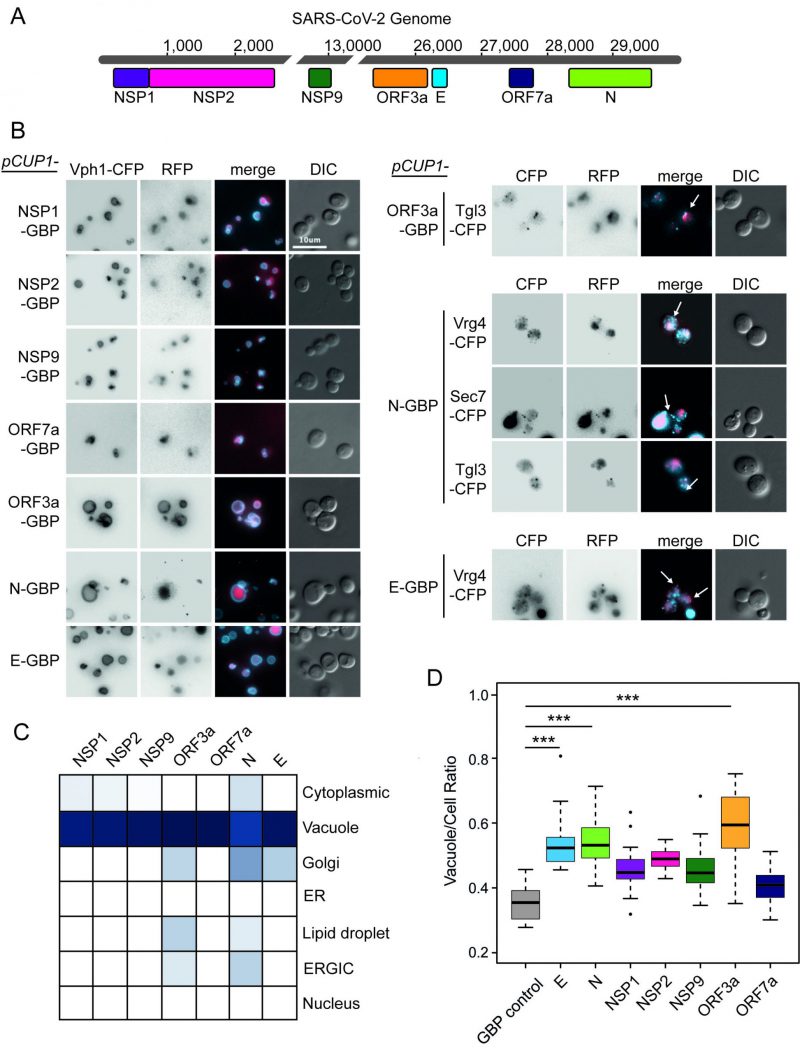
FIGURE 1: Localisation of SARS-CoV-2 proteins in yeast. (A) Seven open reading frames (ORFs) from the SARS-CoV-2 viral genome are illustrated. These ORFs were cloned either in fusion with GBP-GFP or alone and transferred to the GFP collection of strains and growth effects measured. The viral ORF alone and GBP-RFP serve as controls. The respective colours of the seven viral proteins are consistent in data across the remaining figures. (B) Fluorescence micrographs show yeast encoding different CFP-tagged yeast proteins to evaluate cellular position of the GBP-RFP-tagged SARS-CoV-2 proteins. Vph1-CFP is a marker for the vacuolar membrane, Tgl3-CFP for lipid droplets, Vgr4-CFP for the Early Golgi, and Sec7-CFP for the late Golgi. The blue and red channels are shown in greyscale for clarity. The scale bar is 10 µm, note that GBP does not bind to CFP. (C) A summary of SARS-CoV-2 protein localisation based on CFP-marker co-localisation. The blue colour is a representation of the percentage of cells with the SARS-CoV-2 protein co-localised with a specific compartment (dark blue=100%, white=0%; n=~50 cells per strain). (D) Yeast expressing the SARS-CoV-2 proteins have a larger vacuole/cell ratio. The boxplots show median ratio (dark bar) and box extends from the lower (0.25) to upper (0.75) quartiles. The error bars show the minimum and maximum values, defined as either the actual minimum and maximum or 1.5 times the inter-quartile range below and above the lower and upper quartiles respectively. Outliers are shown as dots. The triple asterisks, *** indicate a p value <0.001 using an ANOVA test, n=15 cells per strain. The control strain contains GBP-RFP with no viral protein.

