
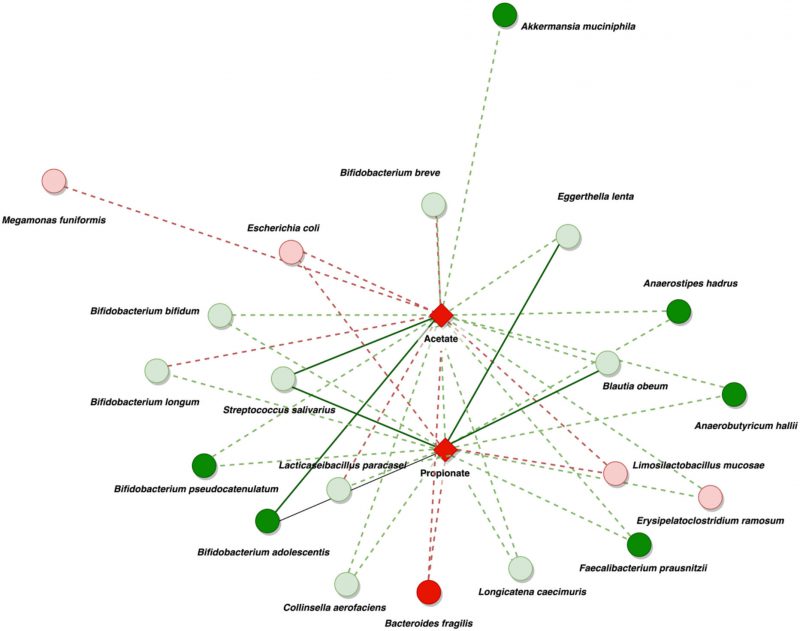
FIGURE 5: Summary of network co-metabolism in DEC samples at the species level. The network illustrates the relationships between bacteria and significant SCFAs in DEC samples. The circles in the diagram symbolize bacteria. The red circles indicate highly abundant bacteria, with a soft red color indicating non-significant abundance and bold red indicating significant abundance. The green circles represent a decrease in bacterial presence, with a soft green color indicating a non-significant decrease and bold green indicating a significant reduction when comparing DEC samples to healthy individuals. Diamonds symbolize metabolites (bold red for significant presence). The biological associations are represented by red and green lines, with red indicating positive and green indicating negative associations. Soft lines suggest non-significant associations, while strong lines imply significant associations.