
Back to article: A complex remodeling of cellular homeostasis distinguishes RSV/SARS-CoV-2 co-infected A549-hACE2 expressing cell lines
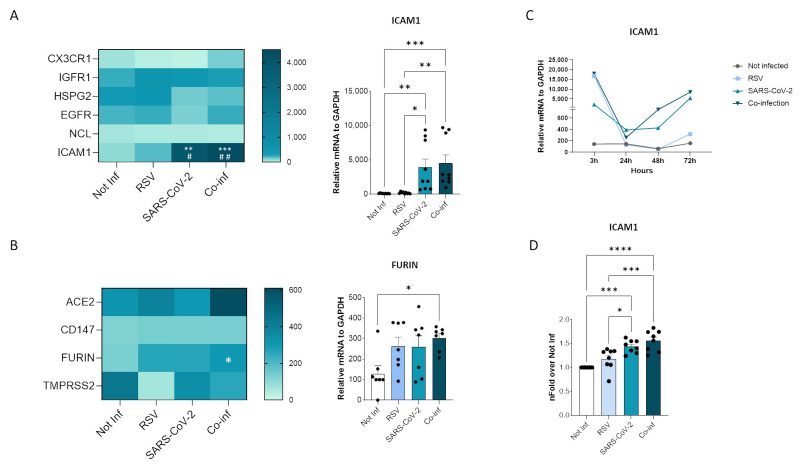
FIGURE 4: Viral receptor expression analyses. Heatmaps representing mRNA expression of RSV (A) and SARS-CoV-2 (B) receptor mRNA expression. Significant differences between groups are indicated by * (vs Not-inf), # (vs RSV) and §(vs SARS-CoV-2) (ANOVA post hoc Tukey test, p values adjusted for multiple comparisons). Mean values are reported. * p < 0.05, **p<0.01, ***p<0.001, ****p<0.0001; those displaying significantly different results have been reported as mean ± SEM histograms from at least n = 3 independent experiments. (C) Time course of ICAM1 mRNA expression. (D) Flow cytometric evaluation of ICAM1 expression on uninfected, RSV single infected, SARS-CoV-2 single infected and co-infected A549-hACE2 cell membranes at 72 hpi. Results (from at least n = 3 independent experiments) are presented as mean ± SEM of n-fold over not-infected condition (Not-inf). Significant differences between groups are indicated by * (ANOVA post hoc Tukey test, p values adjusted for multiple comparisons). * p < 0.05, ***p<0.001, ****p<0.0001.