
Back to article: A complex remodeling of cellular homeostasis distinguishes RSV/SARS-CoV-2 co-infected A549-hACE2 expressing cell lines
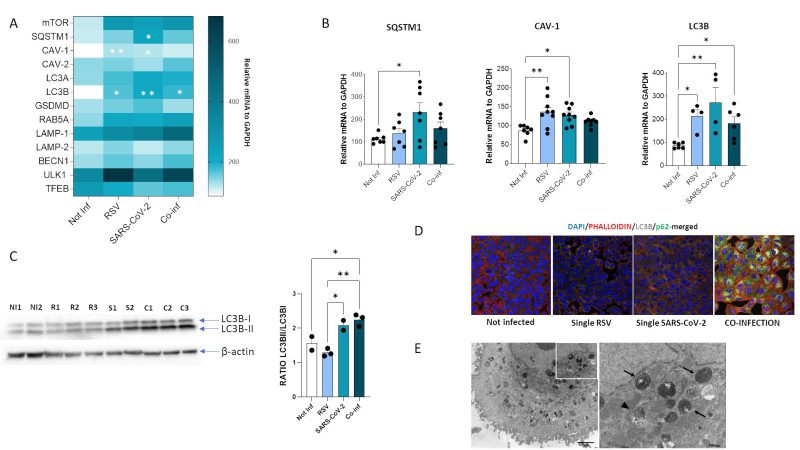
FIGURE 8: Assessment of autophagy process in A549-hACE2 cell lines following RSV, SARS-CoV-2 single infection or co-infection. (A) Heatmap representing mRNA expression of autophagy mediators and (B) significantly expressed autophagy mediators. Results are reported as mean ± SEM from at least n = 3 independent experiments, and significant differences between groups are indicated by * (ANOVA post hoc Tukey test, p values adjusted for multiple comparisons), * p < 0.05, **p<0.01. (C) Western blot analysis of LC3B-I and LC3B-II isoforms in uninfected, RSV, SARS-CoV-2 single infected and co-infected conditions and results reported as mean ± SEM histograms. Significant differences between groups are indicated by * (ANOVA post hoc Tukey test, p values adjusted for multiple comparisons). * p < 0.05, **p<0.01. (D) Immunofluorescent staining showing LC3B (grey) and p62 (green) in uninfected, RSV single infected, SARS-CoV-2 single infected and co-infected conditions. (E) Left panel, representative electron microscopy image of a A549-hACE2 cell coinfected with SARS CoV-2 and RSV at 72 hpi with a large amount of widespread autophagosomes at different steps of the autophagic process (early/initial and late autophagic compartments). Scale bar= 2 µm; right panel, a greater enlargement of the outlined area of the fig. (a) showing an early/initial autophagic vacuole (arrowhead) and late autophagic compartments (arrow). Scale bar= 500 nm.