
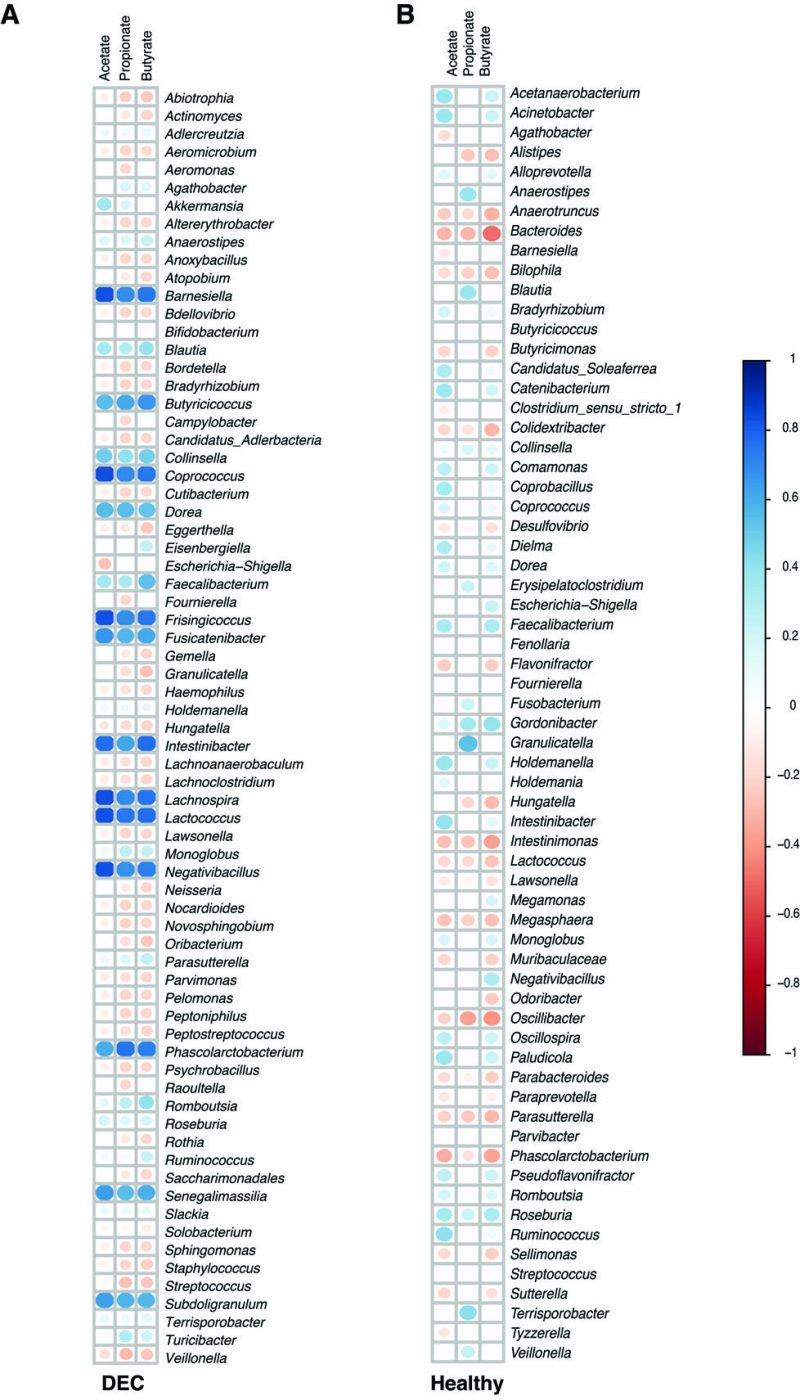
FIGURE 4: Correlation between identified genera and detected levels of SCFAs. Detected acetate, propionate, and butyrate levels within DEC (A) and Healthy (B) groups were correlated using Pearson with the relative abundance of the main genera in each group. Only significant (p < 0.05) correlations are shown; non-significant correlations are shown as empty squares. The intensity of correlation is indicated by the shifting in colors and size of the circles.