
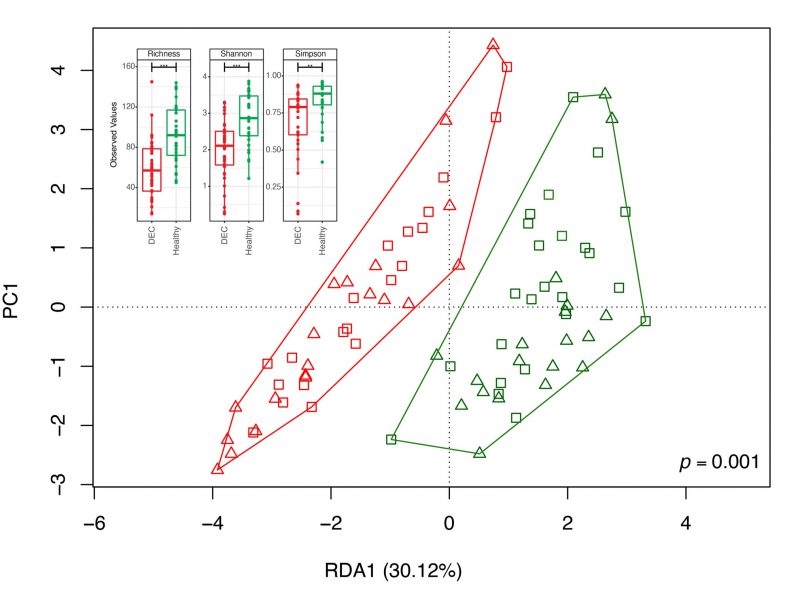
FIGURE 2: Community structure DEC-positive and healthy stool samples and diversity indexes. The distribution of the microbial community in each sample and its clustering based on the sample group were evaluated using a redundancy analysis (RDA). Red and green symbols represent the microbiota compositions observed in the DEC and healthy groups, respectively. Triangles represent samples of children under 3 years old and squares of children between 3 and 5 years of age. The analysis used a sample classification as the explanatory matrix and relative ASV abundance as the response matrix. The data were normalized with a double square root transformation. The clustering significance of the RDA was assessed by ANOVA, utilizing the vegan package for R. The subplot illustrates the variety of alpha diversity indexes of samples for both the DEC and healthy groups.