
Back to article: Forced association of SARS-CoV-2 proteins with the yeast proteome perturb vesicle trafficking
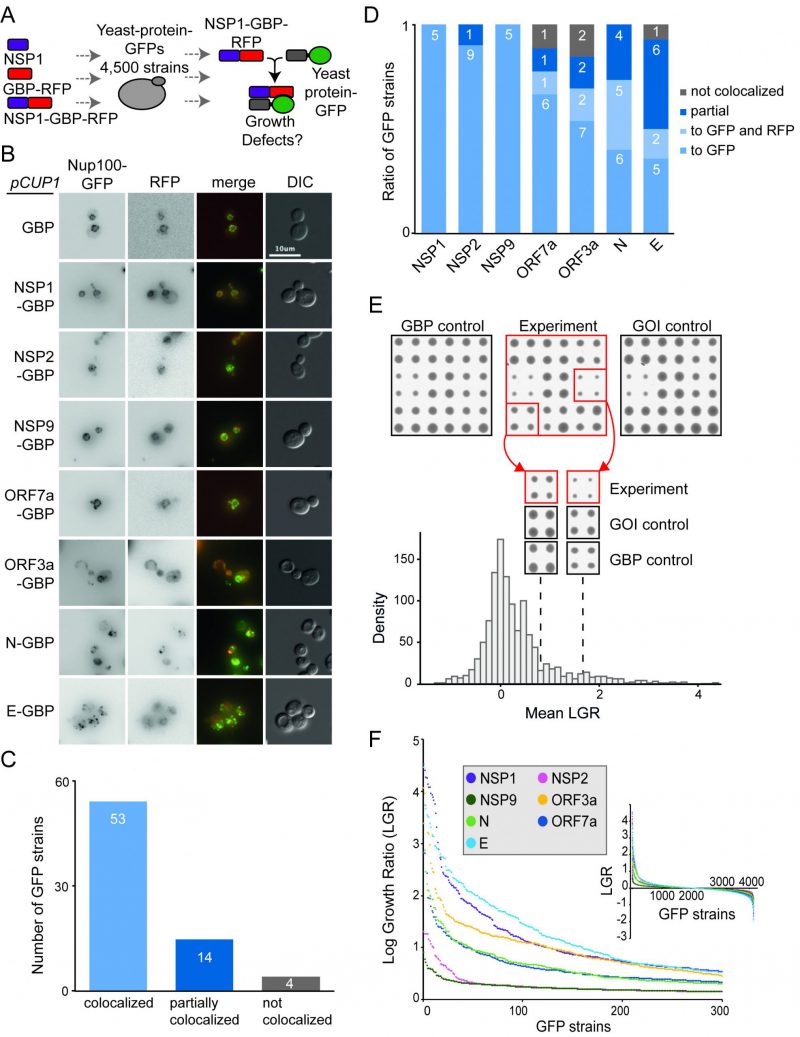
FIGURE 2: Forced binding of SARS-CoV-2-GBP-RFP fusion proteins to the yeast proteome. (A) The schematic illustrates the SPI screen, which involved recruiting SARS-CoV-2 proteins (tagged with GBP) to different GFP proteins, the viral protein alone and GBP alone serve as controls. (B) Fluorescence micrographs of a Nup100-GFP strain containing different viral proteins fused with GBP-RFP are shown. The green and red channels are shown in greyscale for clarity, the scale bar is 10 µM. (C) 71 strains were selected that contain different SARS-CoV-2 proteins tagged with GBP-RFP and different GFP tagged proteins. The GFP tagged proteins were chosen based upon those that had a clearly-visible GFP signal that is located at a defined and easily recognisable location within the cell. Co-localisation of GFP to RFP signal was assessed using fluorescence imaging. 67 of these strains (94%) had GFP and RFP co-localised or partially co-localised. None of the imaged GFP strains were completely recruited away from their natural cellular localisation. (D) The colocalisation data shown collectively in panel C, are separated by each viral protein. In some cases, in N, E ORF7a and ORF3a SPIs, the fusion protein localises to both to the normal location of the GFP protein as well as to the SARS-CoV-2 location described in Figure 1 (e.g. vacuole). This is labeled as ‘localises to GFP and RFP'. (E) Sample images from the screen are shown (top), GFP strains are arrayed in quadruplicate. Colony size is used as a measure of growth. The natural logarithm of the average growth of the control divided by the experiment (log growth ratio, LGR) are calculated. High LGR values indicate that control colonies were larger than the experiment. GOI indicates ‘Gene Of Interest'. The dotted lines indicate the mean LGR value for the examples shown. (F) LGRs between yeast proteome and seven SARS-CoV-2-GBP-RFP fusion proteins are shown (inset) and the strongest 300 SPIs with the highest LGR from all screens are plotted.