
Back to article: Quantification methods of Candida albicans are independent irrespective of fungal morphology
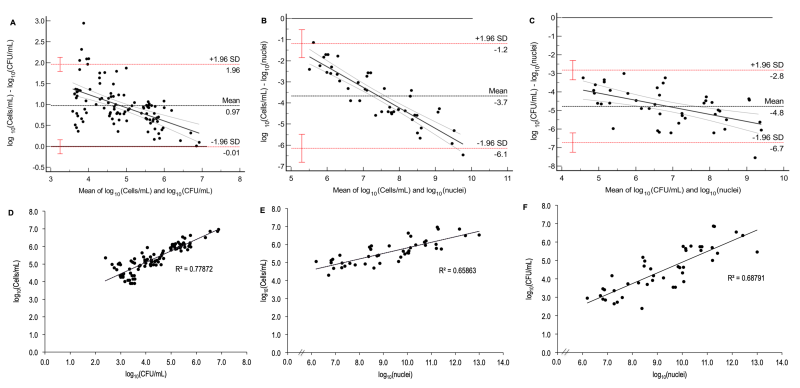
FIGURE 4: Bland-Altman plots and correlation analyses between the methods of cells/mL, CFU/mL, and vPCR (nuclei quntification) for filament growth. The Bland-Altmand plots between cells/mL and CFU/mL (A), vPCR and cells/mL (B) and vPCR and CFU/mL (C) demonstrated lack of agreement, since dots are not evenly distributed around the mean line (black horizontal dotted line); red horizontal dotted lines: limits of agreement (standard deviation, SD), red whiskers: 95% CI of the limits of agreement; black continuos line: regression line showing the proportional bias with the differences between cells/mL and CFU/mL tend to zero as their averages (and values) increase in (A), while the differences between cells/mL and nuclei and also between CFU/mL and nuclei augment (in modulus) as their averages (and values) increase and this trend is more pronounced between cells/mL and nuclei. Correlations between cells/mL and CFU/mL (D), vPCR and cells/mL (E), and vPCR and CFU/mL (F). The coeficient of determination (R2) shows that 78% of variation in cells/mL is explained by CFU/mL, 66% and 69% of variation in cells/mL and CFU/mL, respectively, are explained by vPCR data (nuclei quantification). Data were log10-transformed for all assays.