
Back to article: A complex remodeling of cellular homeostasis distinguishes RSV/SARS-CoV-2 co-infected A549-hACE2 expressing cell lines
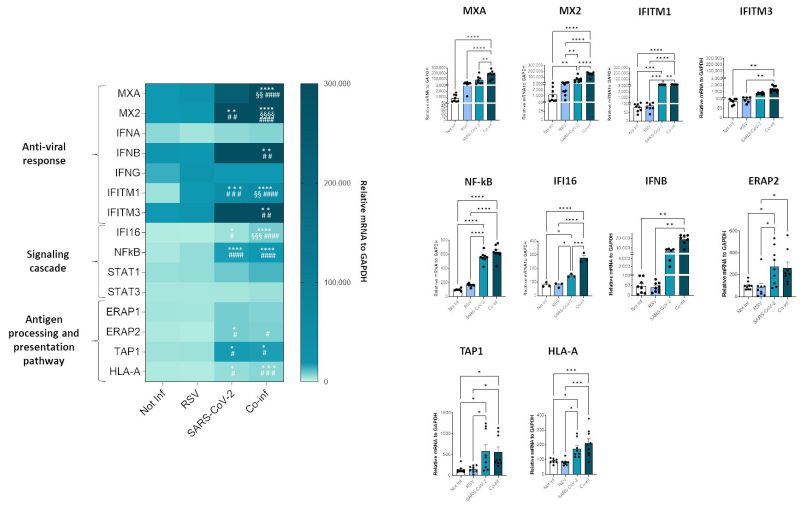
FIGURE 6: Analyses of A549-hACE2 cell line transcriptome following single SARS-CoV-2, RSV infection or co-infection. Antiviral, inflammatory, antigen presentation gene expression was assessed by real-time PCR. Results are summarized in a heatmap; those displaying significantly different results have been reported as mean ± SEM histograms from at least n = 3 independent experiments and significant differences between groups are indicated by * (ANOVA post hoc Tukey test, p values adjusted for multiple comparisons), * p < 0.05, **p<0.01, ***p<0.001, ****p<0.0001.