
Back to article: A complex remodeling of cellular homeostasis distinguishes RSV/SARS-CoV-2 co-infected A549-hACE2 expressing cell lines
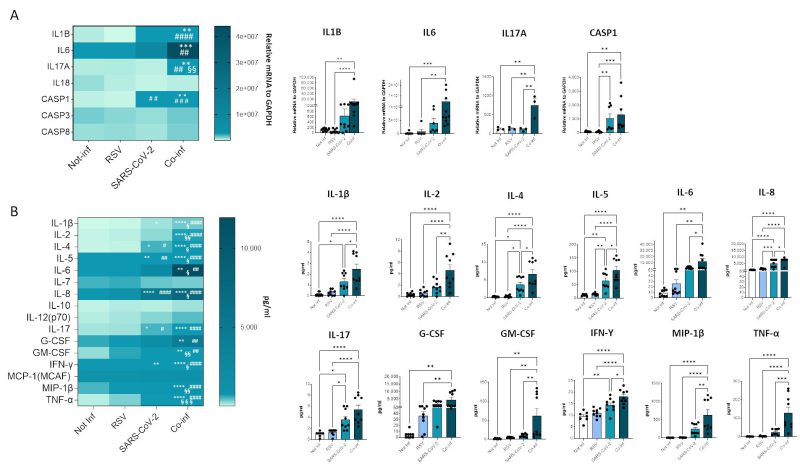
FIGURE 7: Cytokine gene expression and secretion from uninfected, RSV, SARS-CoV-2 single-infected and co-infected A549-hACE2 cell lines. (A) The expression of the main cytokines was assessed by real-time PCR and results are summarized in a heatmap. Significant differences between groups are indicated by * (vs Not-inf), # (vs RSV) and §(vs SARS-CoV-2) (ANOVA post hoc Tukey test, p values adjusted for multiple comparisons). Mean values are reported. * p < 0.05, **p<0.01, ***p<0.001, ****p<0.0001. (B) 17-cytokine/chemokine secretion was assessed by multiplex ELISA in supernatants from A549-hACE2 cell lines 72 hpi; results are summarized in a heatmap. Significant differences between groups are indicated by * (vs Not-inf), # (vs RSV) and § (vs SARS-CoV-2) (ANOVA post hoc Tukey test, p values adjusted for multiple comparisons). Mean values are reported. * p < 0.05, **p<0.01, ***p<0.001, ****p<0.0001. Those displaying significantly different results have been reported as mean ± SEM in histograms from at least n = 3 independent experiments (C) and significant differences between groups are indicated by * (ANOVA post hoc Tukey test, p values adjusted for multiple comparisons), * p < 0.05, **p<0.01, ***p<0.001, ****p<0.0001.