Viewpoint:
Microbial Cell, Vol. 11, No. 1, pp. 321 - 327; doi: 10.15698/mic2024.08.835
Patterns of protein synthesis in the budding yeast cell cycle: variable or constant?

Department of Biochemistry and Biophysics, Texas A&M University, 300 Olsen Blvd. College Station, TX, 77843, U.S.A.
Keywords: metabolic labeling, exponential, linear, single-cell fluorescence.
Received originally: 30/04/2024 Received in revised form: 06/08/2024
Accepted: 09/08/2024
Published: 20/08/2024
Correspondence:
Michael Polymenis, Department of Biochemistry and Biophysics, Texas A&M University, 300 Olsen Blvd. College Station, TX 77843, U.S.A.; michael.polymenis@ag.tamu.edu
Conflict of interest statement: The authors have no conflicts to declare.
Please cite this article as: Eun-Gyu No, Heidi M Blank, Michael Polymenis (2024). Patterns of protein synthesis in the budding yeast cell cycle: variable or constant?. Microbial Cell 11: 321-327. doi: 10.15698/mic2024.08.835
Abstract
Proteins are the principal macromolecular constituent of proliferating cells, and protein synthesis is viewed as a primary metric of cell growth. While there are celebrated examples of proteins whose levels are periodic in the cell cycle (e.g., cyclins), the concentration of most proteins was not thought to change in the cell cycle, but some recent results challenge this notion. The ‘bulk’ protein is the focus of this article, specifically the rate of its synthesis, in the budding yeast Saccharomyces cerevisiae.
THE PROBLEM AND ITS CONTEXT
During each division, the protein content of cells doubles. How does that come about? Is the pattern of overall protein synthesis in the cell cycle constant? For example, is the increase in protein mass proportional to the mass of proteins already present in the cell at any given time? If so, proteins would be produced exponentially, much like money in a bank earning compound interest. The machinery for protein synthesis (i.e., ribosomes) is a significant part of the cell’s protein content 1, and one can see how an exponential pattern of protein synthesis could arise (Figure 1A, bottom panel). Ribosomes make proteins, which make more ribosomes, an ever-increasing amount of proteins, and so on. The above assumes that the newly made ribosomes become immediately available for protein synthesis, making the number of ribosomes per cell the critical determinant of protein synthesis rates 2, 3. Alternatively, if new proteins are made by a fixed absolute amount per unit of time in a cell cycle phase rather than a fixed percentage as in exponential synthesis, then we would have a linear increase in protein synthesis during that phase. Such a linear increase need not be constant in the cell cycle and models of different linear rates of protein synthesis rates at different cell cycle stages are possible 4, 5, 6. Since cells will double their total protein mass in the cell cycle, if the rate of protein synthesis is linear, the rate-to-total protein mass ratio would decline during the cell cycle unless there is an overall doubling of the linear rate of synthesis at one or more points (see Figure 1B, middle panel). In exponential synthesis, however, the rate-to-total protein mass ratio will remain constant throughout the cell cycle (Figure 1B, bottom panel).
–
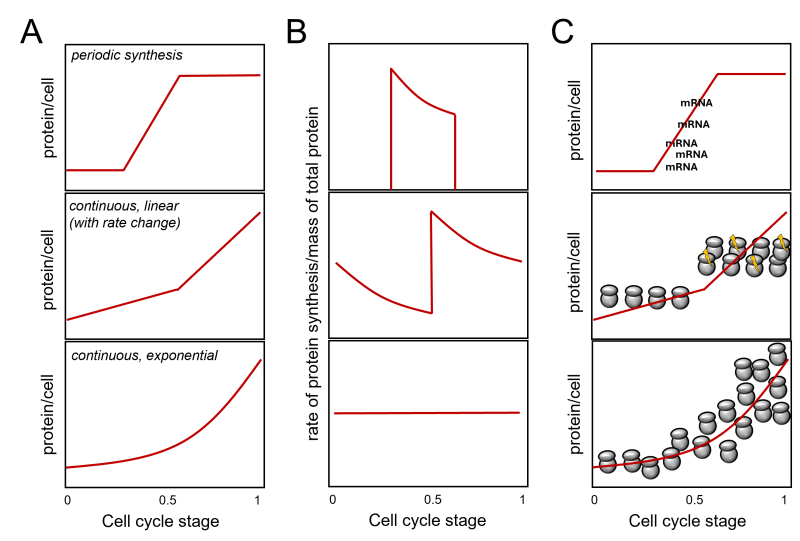 |
FIGURE 1: Protein synthesis in the cell cycle. The cell cycle stage is on the x-axis in all cases. Most of the discussion in the text is about continuous synthesis models leading to the doubling of total protein in the cell during one cell cycle (middle and bottom panels). A periodic synthesis model is shown for comparison on the top. While for certain proteins (e.g., histones [3]) this model is valid, no evidence supports such a pattern for ’bulk’ protein synthesis. Adapted from [5, 6]. In (A), the expected amount of protein per cell (y-axis) is shown for three models. In (B), the expected ratios of the rate (of protein synthesis)-to mass (of total protein) graphs are shown. In (C), a schematic of how a given pattern of protein synthesis in the cell cycle might come about. At the top, a simple case of periodic synthesis arises from the periodic transcription of a gene. However, most genes are not transcribed in a cell cycle- dependent manner [7, 8], arguing again that this model cannot account for periodic ’bulk’ protein synthesis. The middle panel visualizes abrupt linear changes in ribosome numbers and/or activity (indicated with the yellow flashes), doubling protein synthesis rates in the later part of the cell cycle. Note that such changes need not be monotonic. A decline may follow a sharp increase, followed by another sharp rise. In all such cases, however, there will be an irregular, jagged pattern of the protein synthesis rate over the cell’s total protein, as shown in (B). The bottom panel in (C) graphically depicts an exponential increase in ribosome numbers in the cell, leading to a continuous, exponential pattern of protein synthesis rates and a constant ratio of the protein synthesis rate over the cell’s total protein. Combinations of the above models are theoretically possible. |
We also need to keep in mind that budding yeast cells divide asymmetrically, and different patterns of global protein synthesis may be involved not only in different phases of the cell cycle, but also in cells of different generations. Once a Saccharomyces cerevisiae cell commits to a new round of cell division in late G1, at a point called Start, it will generate a bud. From then on, most of the new cell ‘growth’ in the S, G2, and M phases will be directed to the bud in a polarized manner 9. The continuously increasing bud size serves as a convenient proxy for cell cycle position (i.e., the bigger the bud, the more advanced the cell cycle stage). The bud will eventually become the new daughter cell at the end of cytokinesis.
WHY DOES IT MATTER?
The above considerations bear on the mechanisms involved in cell cycle-dependent translational control. If there are changes in linear rates, the expectation is that the levels of many proteins will be cell cycle-regulated. But if the pattern of protein synthesis is exponential, then the converse will be true, with most proteins not changing in concentration in the cell cycle. If global protein synthesis is exponential, with the concentration of ribosomes in the cell staying constant, translational control would be imparted in a transcript-specific manner (e.g., a particular mRNA interacts with some protein or other factors that change its translatability at different points in the cell cycle 10). If, on the other hand, we are dealing with linear patterns of protein synthesis that change in the cell cycle, then changes in the concentration or activity of the protein synthesis machinery could lead to specific translational control of transcripts with elements that make them more sensitive to global changes in ribosomes 11, 12. For example, the translation of mRNAs with sequences that limit the engagement of the encoded ORF with ribosomes (e.g., uORFs or secondary structure) would be disproportionately inhibited when the ribosome content is low 13.
Answering if and how protein synthesis rates are regulated in the cell cycle in yeast will have broader implications, such as understanding the link between protein synthesis and cancer development in human cells. For example, the metabolic fluxes of the large NCI-60 panel of cancer lines are proportional to their protein synthesis rate and their proliferation rate 14. Furthermore, the levels of ~100 proteins that are the most upregulated in abundance in the fastest proliferating lines in the NCI-60 panel are known outputs of the MYC oncogene 15, which has a well-established role in driving protein synthesis in cancer 16, 17. These observations may have therapeutic consequences. NCI-60 cell lines with high protein synthesis rates were more sensitive to inhibitors of the target of rapamycin (TOR) 14, a kinase complex that promotes anabolic processes in all eukaryotes 18, 19.
HOW IS IT STUDIED? METHODS AND APPORACHES
Measuring protein synthesis
Protein synthesis in the budding yeast cell cycle has been monitored in populations and single cells. While classic metabolic labeling approaches typically query cell populations, fluorescence-based methods can probe protein synthesis in single cells. The incorporation rate of a labeled building block into a growing polypeptide chain has been the gold standard for measuring protein synthesis for decades. In dual-labeling, one label is given for hours to label all proteins uniformly. In contrast, a second different label is provided in a short pulse of a few minutes to label only proteins made during a brief period in the cell cycle 6. Applied throughout the cell cycle, with the short pulses given at different times, the ratio of the two labels would yield quantitative estimates of the rate of protein synthesis at various time intervals during cell division. A constant ratio across the cell cycle would indicate that protein synthesis is exponential (see Figure 1B, bottom panel). However, a 2-fold or greater variation in the ratios of the two labels would be consistent with linear synthesis of different rates at different times 6. If the proteins are also resolved by electrophoresis, one can obtain information on the synthesis rate of specific proteins. The labels in such experiments are usually amino acids (e.g., [35S or 3H]-methionine, [14C or 3H]-leucine). In some studies, the pulse signal was normalized against other parameters related to cell cycle progression (e.g., budding, cell size) instead of pre-existing total protein as in the dual label normalization technique.
More recently, non-radioactive precursors, such as L-homopropargylglycine (HPG), an amino acid analog containing an alkyne moiety, which is incorporated into newly synthesized proteins, have gained in popularity. The incorporated HPG is derivatized in a click reaction, becoming fluorescently labeled, affording single-cell imaging and quantification. HPG labeling was recently used to query rates of protein synthesis in the cell cycle of fission yeast 20, 21. To our knowledge, it has yet to be used in budding yeast for similar measurements in the cell cycle. Ribosome profiling has also been used to identify mRNAs with periodic translational control in the budding yeast cell cycle 22, 23. Ribosome profiling does not report protein levels but relies instead on deep sequencing of ribosome-protected mRNA fragments, yielding a direct readout of the translational efficiency of each mRNA 24, 25.
While the above methods interrogate protein synthesis rates, other methods report instead on the abundance and concentration of proteins, which are often used as a proxy for rates of protein production. The rate of protein synthesis is undoubtedly a key determinant of protein concentration in the cell, but not the only and probably not even a major one. In budding yeast, transcriptional control may account for most (~90%) of the global protein output, with translational control and protein stability accounting for the rest 26, albeit this estimate may be too high. In most organisms mRNA levels typically explain between one-third to two-thirds of the variation in protein levels 27. Clearly, one must also consider other variables when using protein abundance as a proxy for protein production rates. On a global scale, protein levels in the budding yeast cell cycle have been queried with mass spectrometry in cell populations 28, 29, 30 and with microscopy from single cells using strains expressing fluorescent epitope-tagged proteins 22.
Knowing where you are in the cell cycle
It is necessary to work with synchronous cell cultures to measure the rate of global protein synthesis in population-based studies. Many of the contradictions in the findings of those studies likely arose from possible artifacts and differences during synchronization 4. Arrest-and-release methods, where cell cycle progression is first blocked by drugs, mating pheromone, or temperature (in cdc mutants) are bound to introduce complexities. During the arrest, the cells continue growing and likely fulfilling their protein synthesis requirements. Hence, when the arrested cells are released from the cell cycle block, the coupling of growth with division is not balanced 31. Alternative synchronization strategies are selection methods, where cells are separated based on a physical property associated with cell cycle progression, such as cell size. Selection methods maintain the physiological coupling between growth and division better. In elutriation, cells are separated by a combination of centrifugal force and a counterflow of fluid. This technique achieves separation as cells will settle at equilibrium positions corresponding to their sedimentation rates 32, 33. The top fraction is small daughter cells in the early G1. Lower fractions are occupied by bigger cells in later cell cycle phases, followed by older and ever larger mother cells. Isolating all these separate fractions sequentially is sometimes called ‘age-fractionation’, which has been used to monitor the pattern of protein synthesis rates in the cell cycle (see Table 1).
TABLE 1. Summary of selected past studies.
|
Protein synthesis assay |
Cell cycle assay |
Medium |
Conclusion |
Citation |
|---|---|---|---|---|
|
Metabolic labeling (rate of synthesis) |
Isopycnic (Ludox density gradient) centrifugation of live cell |
Unclear. Synthetic with and without yeast extract. |
Continuous synthesis of ribosomal proteins |
|
|
Metabolic labeling (rate of synthesis) |
Age fractionation by centrifugal elutriation of live cells |
Synthetic minimal |
Constant exponential increase of >100 abundant proteins |
|
|
Metabolic labeling (rate of synthesis) |
Age fractionation by centrifugal elutriation of live cells |
Synthetic minimal |
Constant exponential increase of ribosomal proteins |
|
|
Metabolic labeling (rate of synthesis) |
Isopycnic (sorbitol density gradient) centrifugation |
Synthetic minimal |
Invariant synthesis for ~700 abundant proteins |
|
|
Metabolic labeling (rate of synthesis) |
Isopycnic (Percoll density gradient) centrifugation of dead cells, treated with cycloheximide and sodium azide |
Synthetic minimal |
Non-exponential increase, rate peaks in the G2 phase |
|
|
Mass spectrometry (overall abundance) |
Release from pheromone arrest |
Rich undefined (YPD) |
The levels of most proteins did not change in the cell cycle |
|
|
Mass spectrometry (overall abundance) |
Centrifugal elutriation |
Rich undefined (YPD) |
The levels of most proteins did not change in the cell cycle |
|
|
Mass spectrometry (overall abundance) |
Release from pheromone arrest |
Synthetic minimal |
Ribosomal protein levels were the highest in the G1 phase |
|
|
Ribosome profiling (translational efficiency) |
Centrifugal elutriation |
Rich undefined (YPD) |
Translational control of most mRNAs did not change in the cell cycle |
|
|
Ribosome profiling (translational efficiency) |
Release from pheromone arrest |
Rich undefined (YPD) |
Translational control of most mRNAs did not change in the cell cycle |
|
|
Fluorescence microscopy (overall abundance – reporter protein) |
Unperturbed, single-cell analysis |
Synthetic complete, with glucose or glycerol/ethanol as carbon sources |
Constant exponential increase |
|
|
Fluorescence microscopy (overall abundance – reporter protein) |
Unperturbed, single-cell analysis |
Synthetic complete |
Linear increase |
|
|
Fluorescence microscopy (overall abundance – reporter protein) |
Unperturbed, single-cell analysis |
Synthetic minimal, with various carbon sources |
Dynamic, rate peaking in G1 |
|
|
Fluorescence microscopy (overall abundance – reporter ribosomal proteins) |
Unperturbed, single-cell analysis |
Synthetic minimal |
Dynamic, rate peaking in G1 and G2/M |
|
|
Fluorescence microscopy (overall abundance – reporter protein) |
Unperturbed, single-cell analysis |
Synthetic minimal |
Dynamic, rate peaking in G1 and G2/M |
|
|
Fluorescence microscopy (overall abundance) |
Unperturbed, single-cell analysis |
Rich undefined (YPD) |
Dynamic, proteome concentration peaks in the late G1 phase by ~30% |
Another technique relies on ‘isopycnic centrifugation’ through a colloidal solution. The cells move to an equilibrium position where their density is the same as the surrounding medium, forming bands at specific points along the density gradient. While techniques like age-fractionation and isopycnic centrifugation have merits, they also have limitations. The synchrony achieved in these methods is not ideal as there can be overlap of different cell populations in the same fraction.
A significant advantage of single-cell, microscopy-based methods is that cell cycle position can be tracked continuously without perturbation, offering much greater resolution than population studies. Using engineered strains expressing fluorescent markers of crucial cell cycle transitions, combined with morphological markers (e.g., cell size, budding), can accurately track cell cycle progression 39, 41. Furthermore, from population sampling, one gets the means of the measured variable, but from single-cell studies, the actual variance from cell to cell and individual cell behaviors become accessible. The disadvantage of single-cell, fluorescence microscopy-based approaches is that detecting protein synthesis in such systems has been indirect. Additional variables, such as photobleaching or artifacts associated with the introduced fluorescent tags, need to be considered. Thus far, single-cell fluorescence methods have mostly queried protein abundances 22, but not necessarily synthesis rates, in the budding yeast cell cycle.
WHAT ARE THE FINDINGS?
As summarized in Table 1, the approaches and findings vary. Let’s start with the older studies that used metabolic labeling to query cell populations. Focusing on the synthesis of the abundant ribosomal proteins, it was reported that they are made throughout the cell cycle, but the study did not have the resolution to detect linear vs. exponential patterns 34. The widely cited studies introducing the double labeling technique 6, 35, 36 reported exponential protein synthesis (corresponding to the bottom panels in Figure 1). These conclusions were challenged later 4 because while the data supported an exponential pattern of synthesis in the G1 phase, the cell fractionation was not good enough to draw the same conclusion for later stages of the cell cycle. Anecdotally, from experiments in our lab, we can attest that the cell size distribution of age-fractionated elutriated samples becomes irregular and broad as one collects successive fractions, indicative of worsening synchrony. Two more older studies combined metabolic labeling with isopycnic centrifugation for cell fractionation (see Table 1). One found that the synthesis rate of most of the hundreds of proteins they analyzed did not change in the cell cycle 37, corresponding to the bottom panels in Figure 1. However, their cutoffs for significant changes may have been too stringent (>3-4-fold) to draw these conclusions 4. A different group reported that the ratio of the labels in a double labeling scheme was not constant in the cell cycle and reached the highest levels in the G2 phase 38, corresponding to the middle panels in Figure 1. What can we conclude then, if anything, from all these metabolic labeling studies? No study reported changing linear rates of protein synthesis early in the cell cycle in the G1 phase, but the issue is unresolved about later phases. A more effective strategy for these labeling experiments would be to elutriate and collect cells in the early G1 daughter fraction only, which is typically highly homogeneous, and track protein synthesis rates as they progress in the cell cycle.
Other population studies using mass spectrometry measured protein abundances in the cell cycle but not synthesis rates. The first study sampled four points in the cell cycle after release from pheromone arrest 30. Only a small number of proteins (<10%) changed abundance significantly (e.g., 83 proteins were upregulated by at least 2-fold between any two points). A study from our lab used centrifugal elutriation to isolate early G1 cells, which were then sampled at eight different points in the cell cycle. We found 333 proteins whose relative abundance changed by at least 2-fold between any two points 28. From experiment-matched samples, transcripts encoding ribosomal proteins and other gene products involved in ribosome biogenesis were significantly upregulated, peaking in the G1 phase. Still, these changes were not evident at the protein level 28. Furthermore, in the same study, when assembled ribosomes were isolated and quantified by mass spectrometry, there was no change in their relative abundance 28. Hence, the increased levels of transcripts encoding ribosome biogenesis components were somehow buffered, and the ribosome concentration did not change at all during the cell cycle. These studies argue against significant changes in global protein synthesis in the cell cycle. However, another mass spectrometry-based study reported an increase in G1 of the mRNA and protein levels for components of the protein synthesis machinery, including ribosomal proteins 29. Albeit significant, the rise in the abundance of ribosomal proteins in G1 was small (~8%) in that study29 and below the threshold used in the others (2-fold; 28, 30).
Fluorescence microscopy has been used to continuously record the levels of constitutive reporter proteins in the cell cycle, usually displayed by integrating the fluorescence signal over each cell at each time point and size. However, the deduced pattern of protein production varies among studies, from exponential39 (corresponding to the bottom panel in Figure 1A), to a constant linear rate during each cell cycle 40 to a more dynamic pattern, peaking in late G1 and exceeding the rate of cell size increase 41, and then peaking again later in the cell cycle 42, 43, (corresponding to variations of the middle panel in Figure 1A). Monitoring the levels of two ribosomal proteins tagged with GFP also revealed dynamic changes in their abundance, peaking in G1, then dropping, but rising again in G2/M 42, corresponding again to variations of the middle panel in Figure 1A. These results were reinforced in yet another study that used the abundance of a reporter GFP construct as a proxy for protein production, arguing that protein synthesis is not monotonic 43. An impressive new study interrogated millions of cells from thousands of individual strains, each expressing every ORF from its endogenous promoter as a GFP-tagged protein 22. Then, using fluorescence imaging of unperturbed cells over time, the location of each protein in the cell and its levels were quantified as a function of cell cycle position. This single-cell analysis found ~800 proteins that change in concentration in the cell cycle, about 60% of them peaking in late G1, ribosomal proteins the most prominent group among them 22. The median increase in the concentration of proteins peaking in G1 was about 30% 22. These findings argue for dynamic protein synthesis in the cell cycle (i.e., corresponding again to variations of the middle panel in Figure 1A), but the mechanistic underpinnings still need to be discovered. It should also be pointed out that translational control in the cell cycle is not widespread. Based on two ribosome profiling studies, less than 5% of all mRNAs show differential translational efficiency in the cell cycle 22, 23.
LOOKING AHEAD
How does one reconcile the evidence outlined above? The different conclusions about whether ribosomal protein concentration changes in the cell cycle may reflect the different thresholds used in each study. Still, whether and how these changes also lead to changes in the ribosome content and global protein synthesis rates has yet to be firmly established. Do these extra ribosomal proteins assemble into functional ribosomes? An important consideration here is the stability of ribosomal proteins and ribosomes. Most ribosomal proteins have a half-life of several hours, based on the values listed in the Saccharomyces Genome Database http://yeastgenome.org 44, which exceeds the cell cycle length in typical laboratory conditions. The half-life of ribosomes has also been reported to be very high in proliferating yeast cells, with no decay detected in a 5h period 45. In other organisms, a half-life of ribosomes of several days has been reported for rat liver ribosomes46, 47 and plants 48. The assumption that a short temporal increase in the abundance of ribosomal parts is a direct proxy for ribosome content and protein synthesis rates is far from straightforward.
Another confounding variable among the studies is the different media used (see Table 1). The concentration of ribosomes in the cell is higher in rich nutrients than in poor ones 49. Nutrient-sensitive pathways (e.g., the protein kinase A (PKA) or the target of rapamycin (TOR) signaling networks) respond to the available nutrients (e.g., quality of the carbon and nitrogen sources) to adjust ribosome synthesis. However, it is unknown if these or any other pathways change the rate of protein synthesis in a cell cycle-dependent manner in cells growing and dividing in a steady state in a given nutrient environment. Such causal links would need to be examined in the future, especially since recent work has shown that the activity of the above pathways is dynamic in the cell cycle 42, 43, 50. As to how translation could be affected, while control of protein synthesis rates is often assumed to be exercised primarily at the initiation stage, elongation control due to unusual codon usage and ribosome pausing has gained attention 51. We note, however, that among components of the translation machinery it is mutations in initiation factors that overwhelmingly lead to specific cell cycle phenotypes in budding yeast 52. Furthermore, there is no evidence for altered codon usage in the budding yeast cell cycle 28. Changes in tRNA abundance are also unlikely to impact the cell cycle, because the half-life of mature tRNAs (>10 h to several days; 53) far exceeds the duration of the cell cycle in most conditions. Hence, if rates of protein synthesis change in the cell cycle, pathways that impinge on initiation are likely to be involved.
Future research holds promise in settling the discrepancies and filling the gaps in our knowledge. Including metabolic labeling to query protein synthesis rates, preferably in a single-cell context, could combine the advantages of all the methods. This approach has been recently demonstrated in fission yeast, where it was found that translation rates scale with cell size through most of the cell cycle in this organism, and plateau only in very large cells in mitosis 20. In the near future, we can also expect detailed translatomics of each mRNA in the cell cycle at single-cell resolution, thanks to rapidly evolving technologies 54. Once the patterns of global protein synthesis are firmly established, progress on specific mechanisms of translational control in the cell cycle will follow.
For full bibliography please see the pdf file.
ACKNOWLEDGMENTS
Work in the authors’ laboratory is supported by grant GM123139 from the National Institutes of Health to M.P.
COPYRIGHT
© 2024

Patterns of protein synthesis in the budding yeast cell cycle: variable or constant? by No et al. is licensed under a Creative Commons Attribution 4.0 International License.