Back to article: Patterns of protein synthesis in the budding yeast cell cycle: variable or constant?
44.
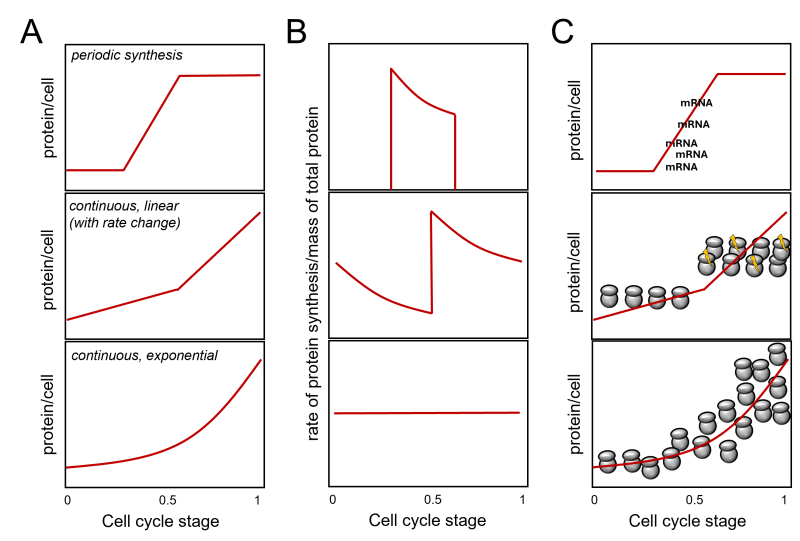
FIGURE 1: Protein synthesis in the cell cycle. The cell cycle stage is on the x-axis in all cases. Most of the discussion in the text is about continuous synthesis models leading to the doubling of total protein in the cell during one cell cycle (middle and bottom panels). A periodic synthesis model is shown for comparison on the top. While for certain proteins (e.g., histones [3]) this model is valid, no evidence supports such a pattern for ’bulk’ protein synthesis. Adapted from [5, 6]. In (A), the expected amount of protein per cell (y-axis) is shown for three models. In (B), the expected ratios of the rate (of protein synthesis)-to mass (of total protein) graphs are shown. In (C), a schematic of how a given pattern of protein synthesis in the cell cycle might come about. At the top, a simple case of periodic synthesis arises from the periodic transcription of a gene. However, most genes are not transcribed in a cell cycle- dependent manner [7, 8], arguing again that this model cannot account for periodic ’bulk’ protein synthesis. The middle panel visualizes abrupt linear changes in ribosome numbers and/or activity (indicated with the yellow flashes), doubling protein synthesis rates in the later part of the cell cycle. Note that such changes need not be monotonic. A decline may follow a sharp increase, followed by another sharp rise. In all such cases, however, there will be an irregular, jagged pattern of the protein synthesis rate over the cell’s total protein, as shown in (B). The bottom panel in (C) graphically depicts an exponential increase in ribosome numbers in the cell, leading to a continuous, exponential pattern of protein synthesis rates and a constant ratio of the protein synthesis rate over the cell’s total protein. Combinations of the above models are theoretically possible.

