Back to article: A simple microfluidic platform to study age-dependent protein abundance and localization changes in
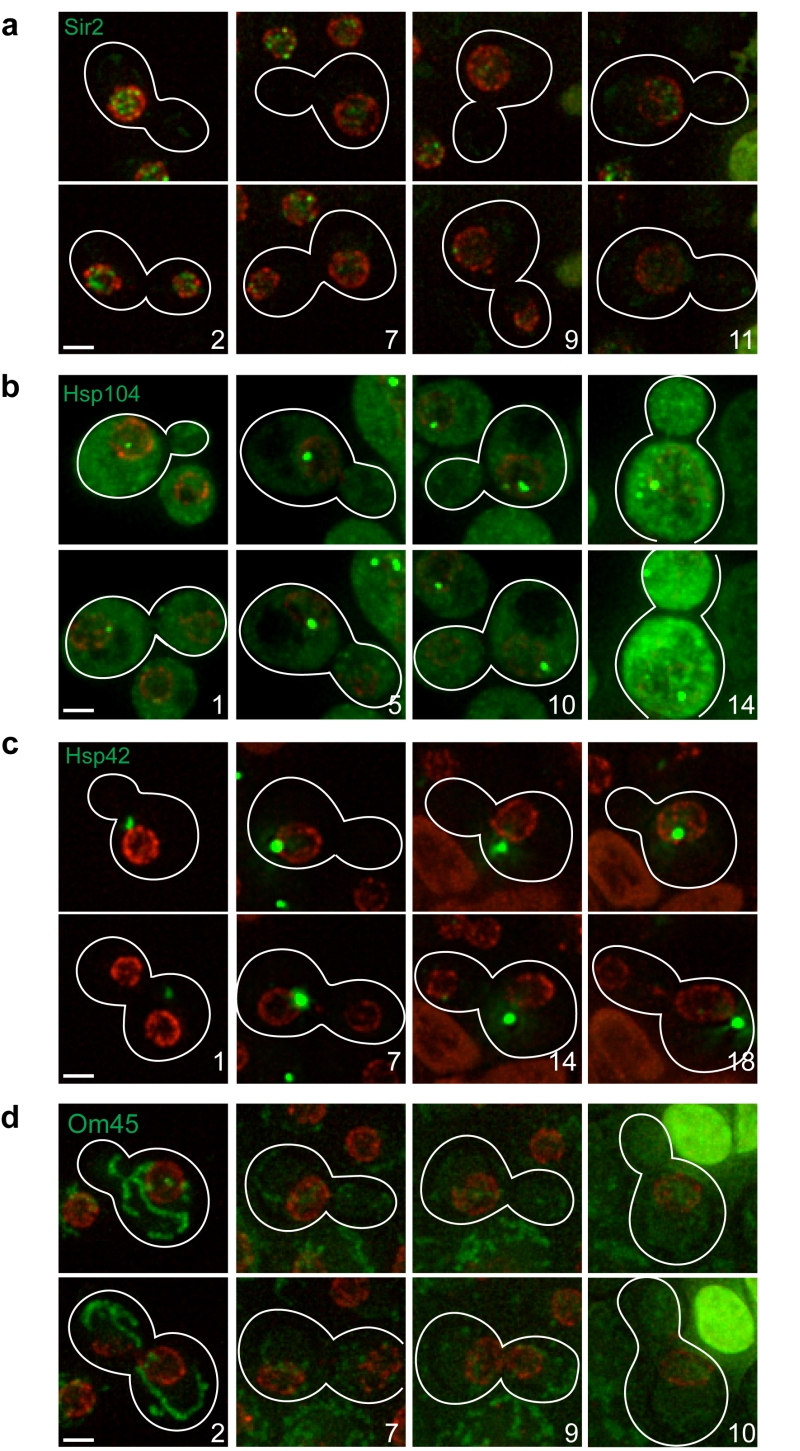
Figure 2: Protein localization changes as cells age. MEP cells expressing Sir2-GFP (a), Hsp104-GFP (b), Hsp42-GFP (c), or Om45-GFP (d) were ana-lysed by time-lapse microscopy. Nup49-mCherry was used as marker of the nuclear periphery. Upper and lower images corresponding to the same division, usually 20-60 min apart, are shown to detect possible cell cycle-dependent changes in localization. Stacks of 8–9 sections (0.4 µm spacing) acquired at different time points were deconvolved (maximal projection is shown). Bright-field images were used to draw cell boundaries and count the number of divisions for the mother cells (age indicated with numbers). Representative images are shown. For Sir2-GFP, all six cells analysed showed the same phenotype. For Hsp104-GFP, Hsp42-GFP and Om45-GFP, 10 of 14, 6 of 7 and 11 of 13 cells, respectively, showed the phenotype depicted and described in the text. Scale bar, 2 µm.

