Back to article: Aminoglycoside resistance profile and structural architecture of the aminoglycoside acetyltransferase AAC(6’)-Im
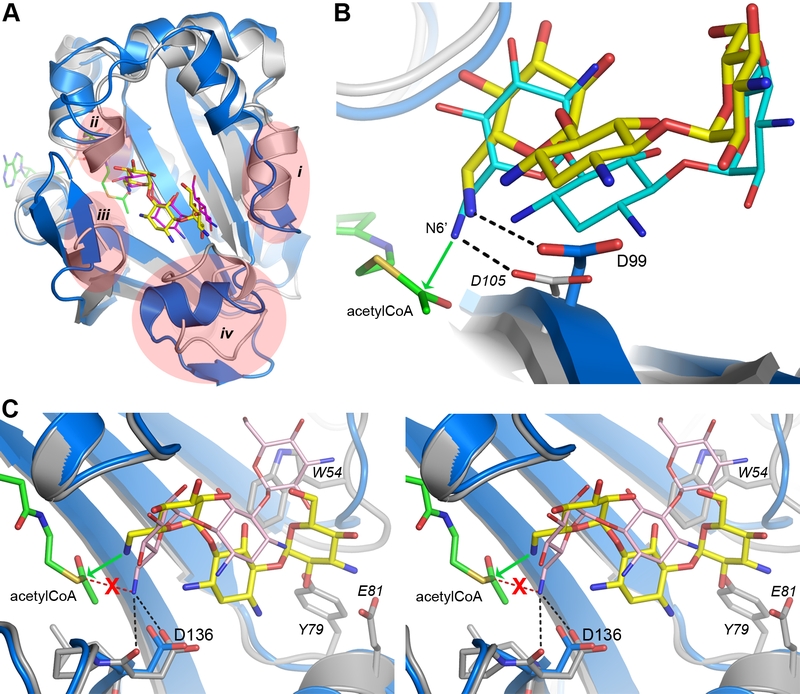
FIGURE 5: Structural comparison of AAC(6’)-Im and AAC(6’)-Ib. (A) Superposition of AAC(6’)-Im (blue) and AAC(6’)-Ib (grey). Kanamycin A is shown in yellow sticks for AAC(6’)-Im and kanamycin C in magenta sticks for AAC(6’)-Ib. The acetyl-CoA cofactor present in AAC(6’)-Ib is shown as green sticks. The four main regions of structural difference near the substrate binding site are indicated in pale red, as described in Figure S4A. (B) Close up view of superimposed kanamycin A substrates in AAC(6’)-Im (yellow with the enzyme shown in blue) and AAC(6’)-Ib (cyan with the enzyme shown in grey). In AAC(6’)-Ib the N6’ group is positioned by a hydrogen bond to the Asp105 side chain (labeled in italics), and the favorable close approach of the N6’ to the acetyl carbon is shown by the green arrow. A similar hydrogen bonding interaction is seen in AAC(6’)-Im with the Asp99 side chain. (C) Stereoview close up of the active site in AAC(6’)-Ie (grey) superimposed onto AAC(6’)-Im (blue). The kanamycin A substrates in AAC(6’)-Im (yellow) and AAC(6’)-Ie (pink) are shown. The difference in orientation of the two aminoglycosides directs the N6’ group in AAC(6’)-Ie away from the acetyl-CoA, where it is anchored by two hydrogen bonds to Asp136. The favorable approach of the N6’ group to the acetyl carbon in the AAC(6’)-Im-bound kanamycin A is indicated by the green arrow, and what would be a unfavored orientation in AAC(6’)-Ie is indicated by a red dashed line. Residues from AAC(6”)-Ie are labeled in italics.

