
Back to article: A genome-wide screen for FTY720-sensitive mutants reveals genes required for ROS homeostasis
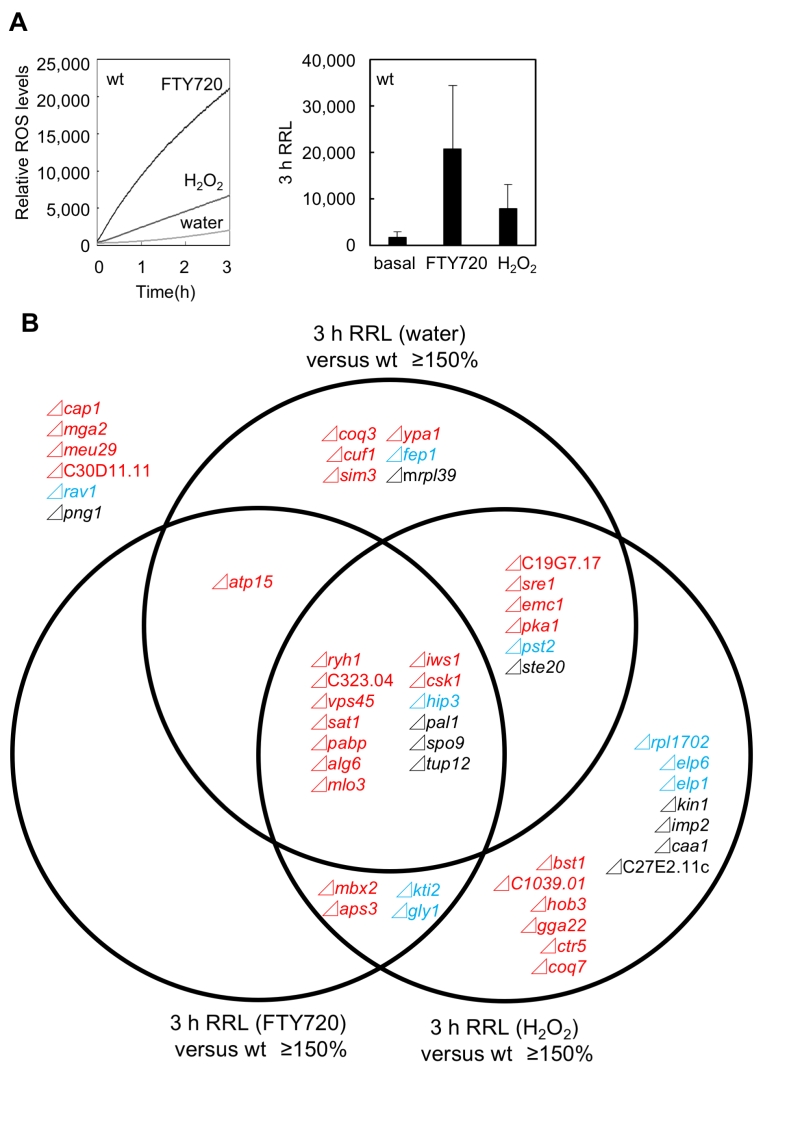
FIGURE 5: Summary of the difference of ROS production in these FTY720-sensitive mutants. (A) The addition of FTY720 or H2O2 produced ROS in the wt strain (KP178). Left panel: measurement of ROS production treated with water, 30 μM FTY720 or 2 mM H2O2. ROS accumulation was measured for 3 h. The data shown are representative of multiple experiments. Right panel: Histograms show the average of peak heights from three independent experiments shown in the left panel. Error bars, SD. (B) Venn diagram showing the overlap between mutants that exhibited higher ROS levels (defined as >150% of RRL (Relative ROS Levels) of the wt strain) in the absence or presence of FTY720 or H2O2 treatment for 3 hr (Figure 6).