
Back to article: Alcohols enhance the rate of acetic acid diffusion in S. cerevisiae: biophysical mechanisms and implications for acetic acid tolerance
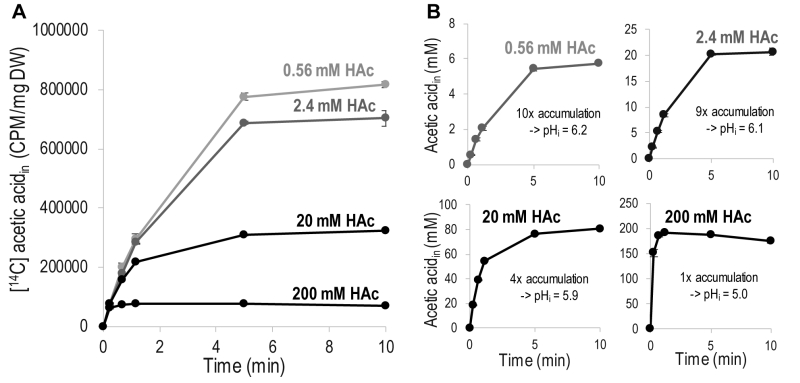
FIGURE 1: Diffusion of acetic acid (HAc) into S. cerevisiae as a function of time. Diffusion was measured in phthalate buffer at pH 5 using 1 µCi [14C] acetic acid mixed with non-labeled acetic acid to the indicated final concentrations. (A) Acetic acid accumulation showing only the signal from [14C] acetic acid. (B) Accumulation of total (labeled + unlabeled) acetic acid inside the cell. Calculated from the [14C] acetic acid signal assuming a cell volume of 2 µL/mg dry weight. The indicated magnitude of accumulation is given by the maximum concentration of intracellular acetic acid divided by the concentration of acetic acid added to the diffusion assay. The amount of acetic acid accumulated was then converted into intracellular pH values (pHi) using the Henderson-Hasselbalch equation. The data given are the mean of three biological replicates, and the error bars indicate the standard deviation. Abbreviations; DW, cell dry weight; CPM, counts of 14C decay per minute.