
Back to article: Alcohols enhance the rate of acetic acid diffusion in S. cerevisiae: biophysical mechanisms and implications for acetic acid tolerance
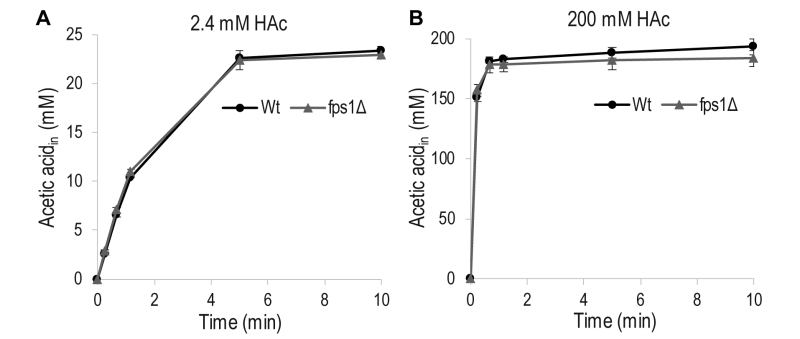
FIGURE 2: Accumulation of acetic acid (HAc) in wild-type (wt) S. cere-visiae cells and cells lacking the aquaglyceroporin Fps1 (fps1Δ) as a function of time. Diffusion was measured in phthalate buffer at pH 5 using 1 µCi [14C] acetic acid mixed with non-labeled acetic acid to the indicated final concentrations. Accumulation of total (labeled + unlabeled) acetic acid inside the cell when (A) 2.4 mM acetic acid was added, and (B) when 200 mM acetic acid was added. The data given are the mean of three biological replicates, and the error bars indicate the standard deviation.