
Back to article: Alcohols enhance the rate of acetic acid diffusion in S. cerevisiae: biophysical mechanisms and implications for acetic acid tolerance
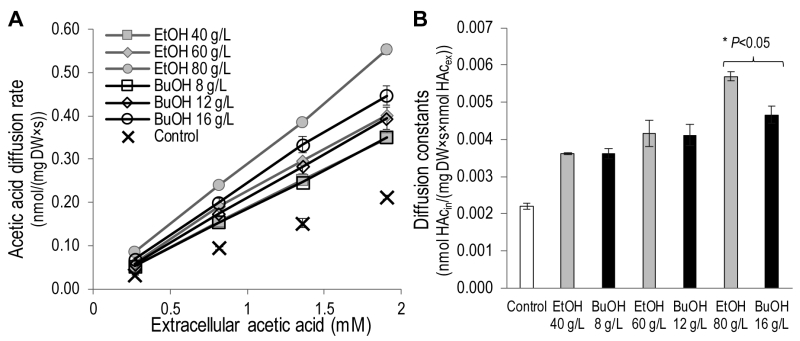
FIGURE 3: Kinetics of the acetic acid diffusion rate in S. cerevisiae in response to ethanol concentrations of 40 – 80 g/L and n‑butanol concentrations of 8 – 16 g/L. (A) Acetic acid diffusion rate as a function of extracellular acetic acid. (B) Diffusion constants calculated from the slope of the kinetics curves presented in A, although the number of moles of extracellular acetic acid was plotted on the x-axis instead of the molar concentration. The data given are the means of three biological replicates, and the error bars indicate the standard deviation. *Statistically significant difference according to the t-test.