
Back to article: Alcohols enhance the rate of acetic acid diffusion in S. cerevisiae: biophysical mechanisms and implications for acetic acid tolerance
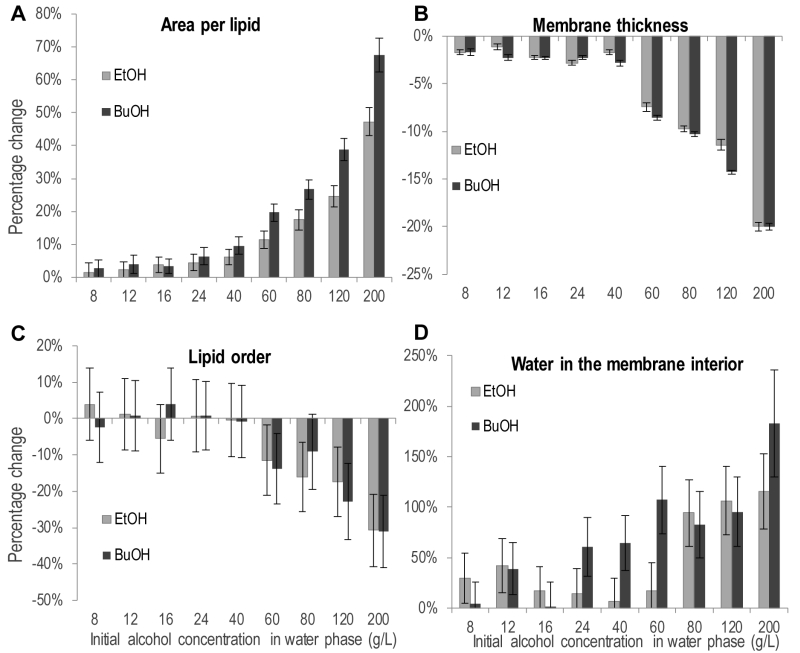
FIGURE 6: The effect of ethanol and n‑butanol on physiochemical membrane properties. (A) Area per lipid. (B) Membrane thickness. (C) Lipid order, calculated from the deuterium order parameter on the short chain of the IPC lipid. (D) Water in the membrane interior, defined as the number of water molecules in the lipid tail section of the bilayer. Percentage increase or decrease compared to the simulation without alcohol. The data shown are the mean over one simulation ± standard deviation.