
Back to article: Alcohols enhance the rate of acetic acid diffusion in S. cerevisiae: biophysical mechanisms and implications for acetic acid tolerance
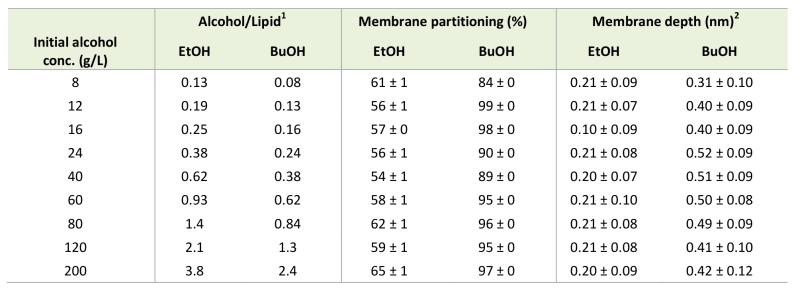
TABLE 2. Partitioning of ethanol and n-butanol in the membrane at the simulated alcohol concentrations.
1 The total amount of alcohols added to the simulation divided by the number of simulated li-pids.
2 Depth of the terminal methyl group of ethanol and n-butanol in the membrane. Values given are the mean over one simulation
± standard deviation.