
Back to article: Yeast quiescence exit swiftness is influenced by cell volume and chronological age
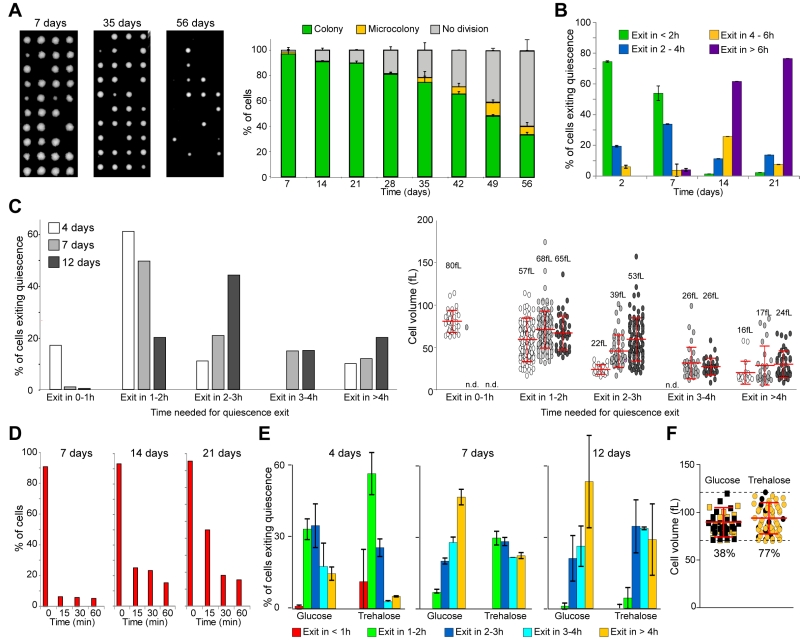
FIGURE 2: Quiescence exit swiftness decreases with chronological age. (A) Cell ability to form a colony decreases with chronological age. Percentage of wild type prototroph FY4 cells able to form a colony in function of the time spend in YPDA at 30°C. Individual cells were isolated by micro-manipulation and allowed to grow 3 days at 30°C on YPDA plates (examples are shown). The percentage of cells able to give rise to a colony or a micro-colony (less than 10 divisions) was scored (n=240, N=3). (B) Quiescence exit efficiency in function of chronological age. Wild type cells were grown in YPDA at 30°C for the indicated time and re-fed on a YPD-containing microscope agarose pad. Quiescence exit efficiency was scored for each time point (n>300, N=2). (C) Quiescence exit efficiency in function of chronological age. Wild type cells were grown in YPDA at 30°C for the indicated time, then re-fed on a YPD-containing microscope agarose pad. Left panel: percentage of cells able to exit quiescence within the indicated time frame. Right panel: cell initial volume in quiescence; median volume and SD are indicated. (D) Actin body mobilization upon quiescence exit. Wild type cells expressing the actin binding protein Abp1-3xGFP were grown in YPDA at 30°C. Glucose (4% final) was added to the medium and the actin cytoskeleton organization was analyzed (n>200, N=2). (E) Trehalose influences quiescence exit efficiency. Wild type prototroph CEN-PK cells were grown 24 h in YP pH 5 containing 4% glucose or 2% glucose + 2% trehalose, then washed and inoculated in YP without sugar for the indicated time. Quiescence exit was triggered on a YPD-containing microscope agarose pad, for each time point n>100 N=2. (F) Cell’s ability to exit quiescence after 12 days of culture in the presence of 4% glucose or 2% glucose + 2% trehalose, within the initial volume range of 70 to 120 fL (n>45). Number are the percentage of cells exiting quiescence in less than 2 h (in yellow) within all the cells capable of exiting quiescence (quiescence exit in > 2 h in black). Histograms represent means and bars are SD.