
Back to article: A global view of substrate phosphorylation and dephosphorylation during budding yeast mitotic exit
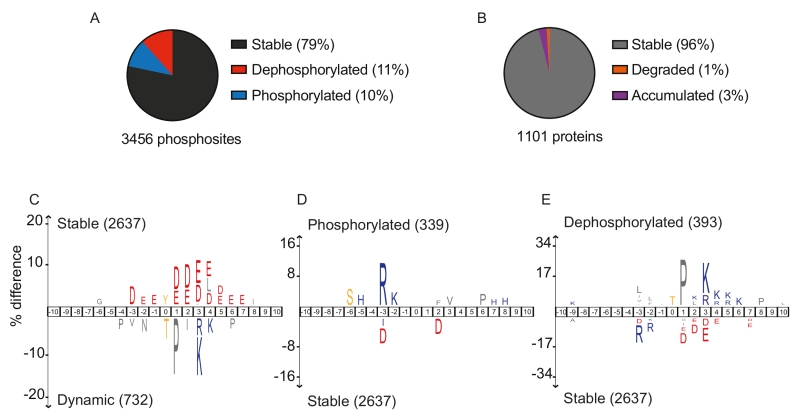
FIGURE 1: Dynamic phosphosite behavior during mitotic exit correlates with sequence surroundings. (A) Fractions of stable (black), dephosphorylated (red) and phosphorylated (blue) phosphosites during mitotic exit. (B) Fractions of stable (grey), degraded (orange) and accumulated (purple) proteins. (C-E) IceLogo motif analyses to reveal sequence elements enriched around phosphorylation sites. These analyses compared (C) dynamic versus stable, (D) phosphorylated versus stable and (E) dephosphorylated versus stable phosphosites. The phosphorylated residues are at position ‘0’. Larger letter size indicates increasing enrichment, cutoff for enrichment detection was p = 0.01.