
Back to article: Temporal analysis of the autophagic and apoptotic phenotypes in Leishmania parasites
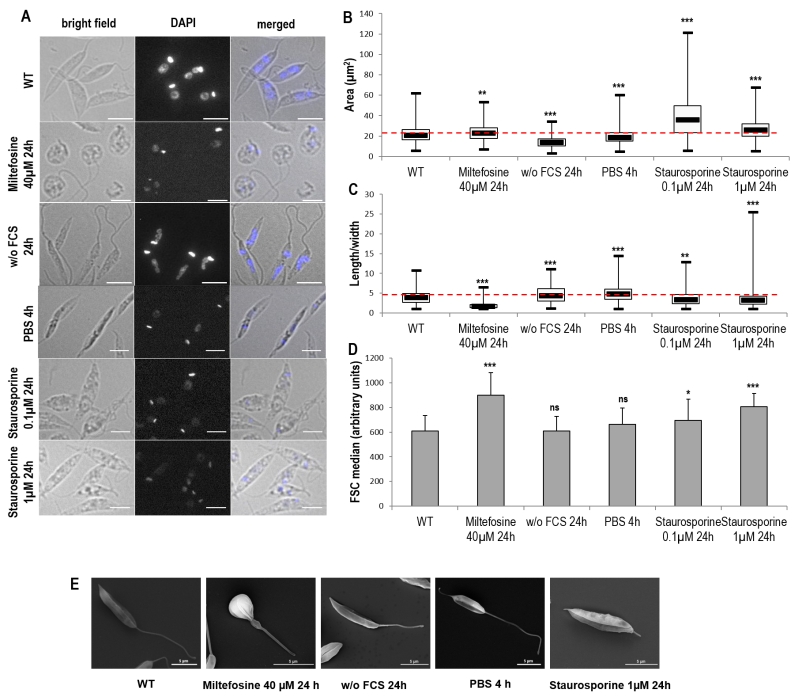
FIGURE 2: Cell morphology during Leishmania cell death and autophagy. (A) Microscopical observation of cells in different culture conditions: bright field, DAPI and bright field/DAPI merged image (bar = 5µm). (B-C) Box plots representing area (B) and length-to-width ratio (C) of cells cultivated in different conditions. A minimum of 475 cells were counted for each condition, from a minimum of three independent experiments. The thick line inside each box represents the median value; the lower and upper edge of each box indicates the 25th and 75th percentiles, respectively; the lower and upper whiskers (ends of the box arms) represent the minimum and maximum, respectively. (D) FSC median calculated by flow cytometry of cells cultivated in different conditions. Mean ± SD from a minimum of thirteen independent experiments. (E) Scanning electron microscopy representative images (bar = 5 µm). Unpaired t-test: ns not significant, * p < 0.05, ** p < 0.01, *** p < 0.001.